Splunk Installation:
On Google Cloud Windows 2016 VM
On Prem Linux CentOS 7:
1. Change Web Management Port from 8000 to 80
Splunk enterprise default http/https port is 8000. You can use either Splunk Web GUI to change it to some other port.
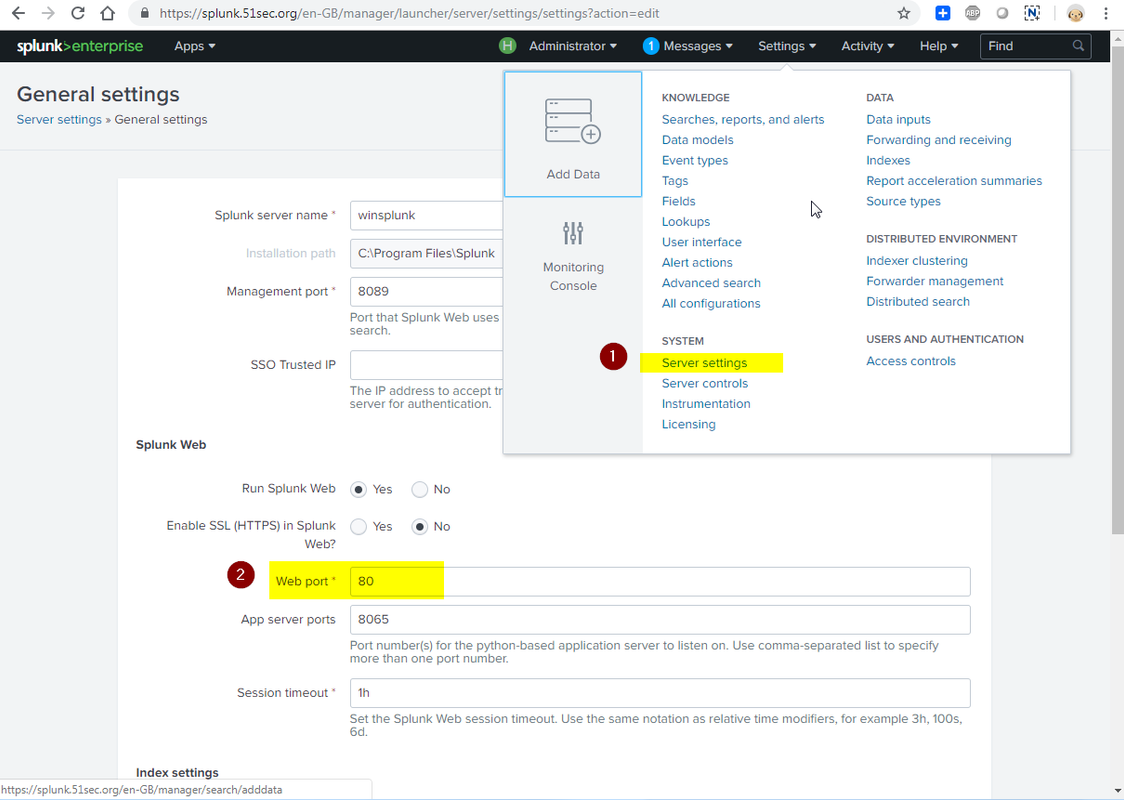
To change the ports from their installation settings:
- Log into Splunk Web as the admin user.
- Click Settings in the top-right of the interface.
- Click the Server settings link in the System section of the screen.
- Click General settings.
- Change the value for either Management port or Web port, and click Save.
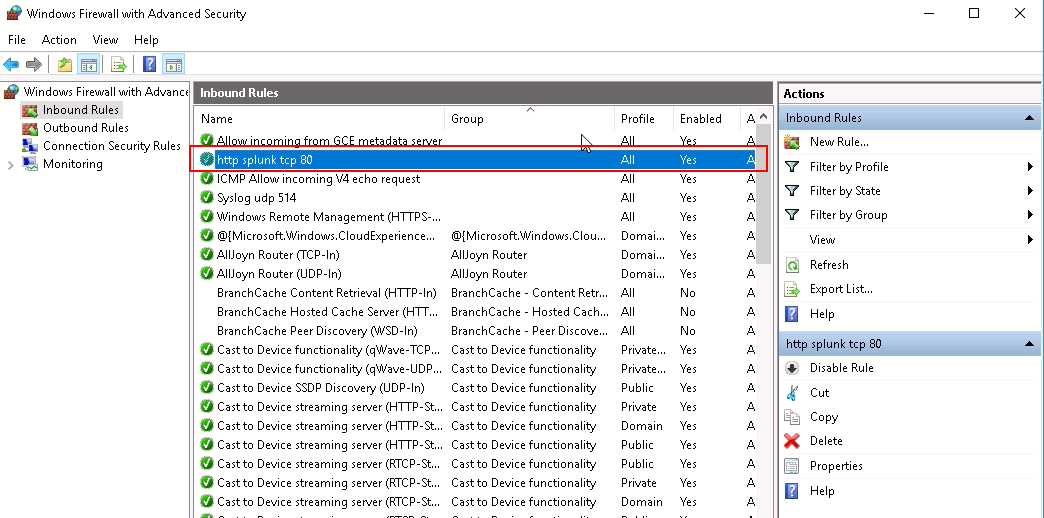
You may need to update your local firewall configuration based on your new port. Here is an example to change my Windows 2016 server's firewall configuration to allow tcp port 80.
2. Fortinet Fortigate App for Splunk
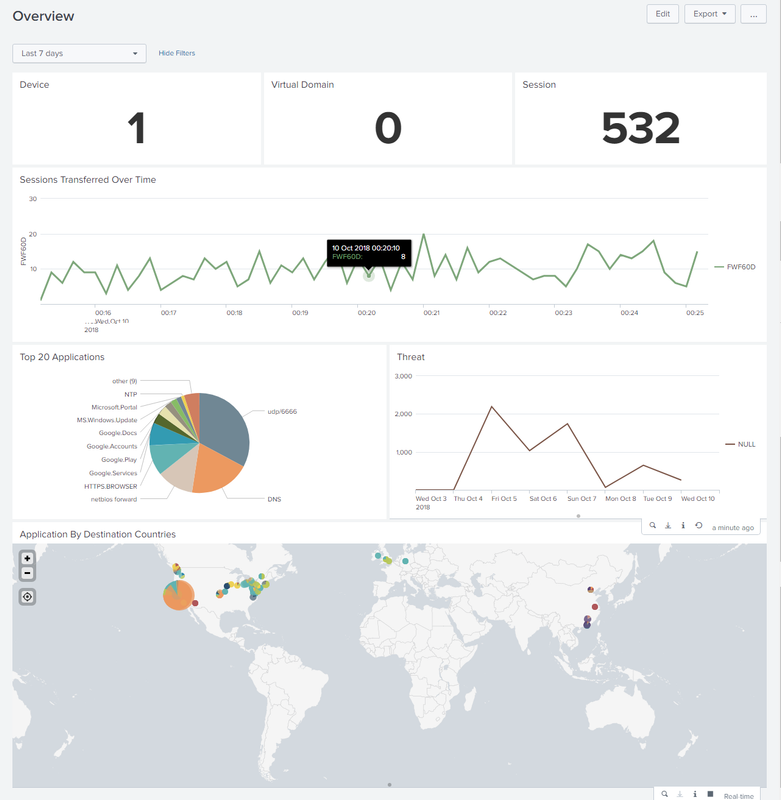
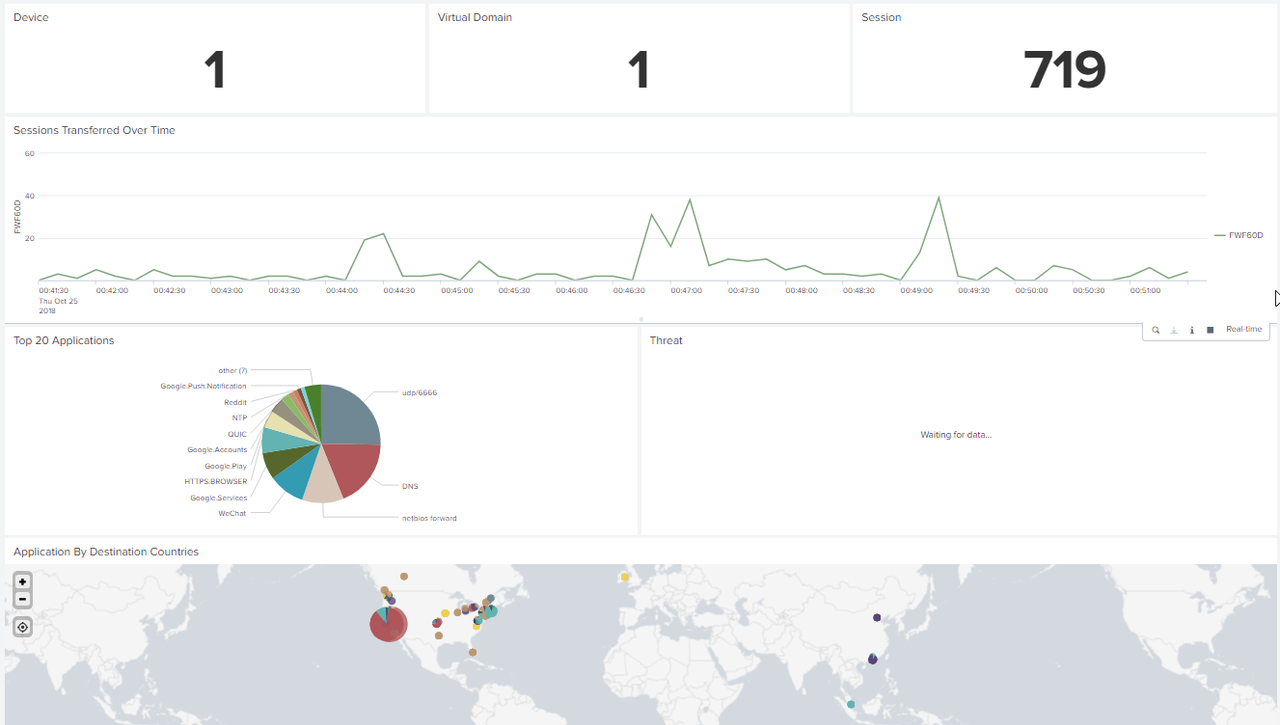
2.1 Device
type="traffic" AND index="fortinet" | stats dc(devid)
2.2 Virtual Domains
type="traffic" AND index="fortinet" | eval dev-vd= devid."-".vd | stats dc(dev-vd)
2.3 Sessions
Original:
type="traffic" AND index="fortinet" | eval dev-sess= devid."-".session_id | stats dc(dev-sess)
Change to :
type="traffic" AND index="fortinet" | eval dev-sess= devid."-".sessionid | stats dc(dev-sess)
type="traffic" AND index="fortinet" | stats dc(sessionid)
2.4 Session Transferred Overtime
index="fortigate" type="traffic" |timechart count by devname
2.5 Top 20 Applications
index="fortigate" type="traffic" | TOP limit=20 app
2.6 Threat
type="UTM" AND index="fortinet" AND (apprisk=critical OR apprisk=high OR apprisk=medium OR apprisk=low) | timechart count by apprisk
2.6 Application by Destination Countries
index="fortigate" type="traffic" | iplocation "dstip" | geostats count by app
3. Customized Dashboard
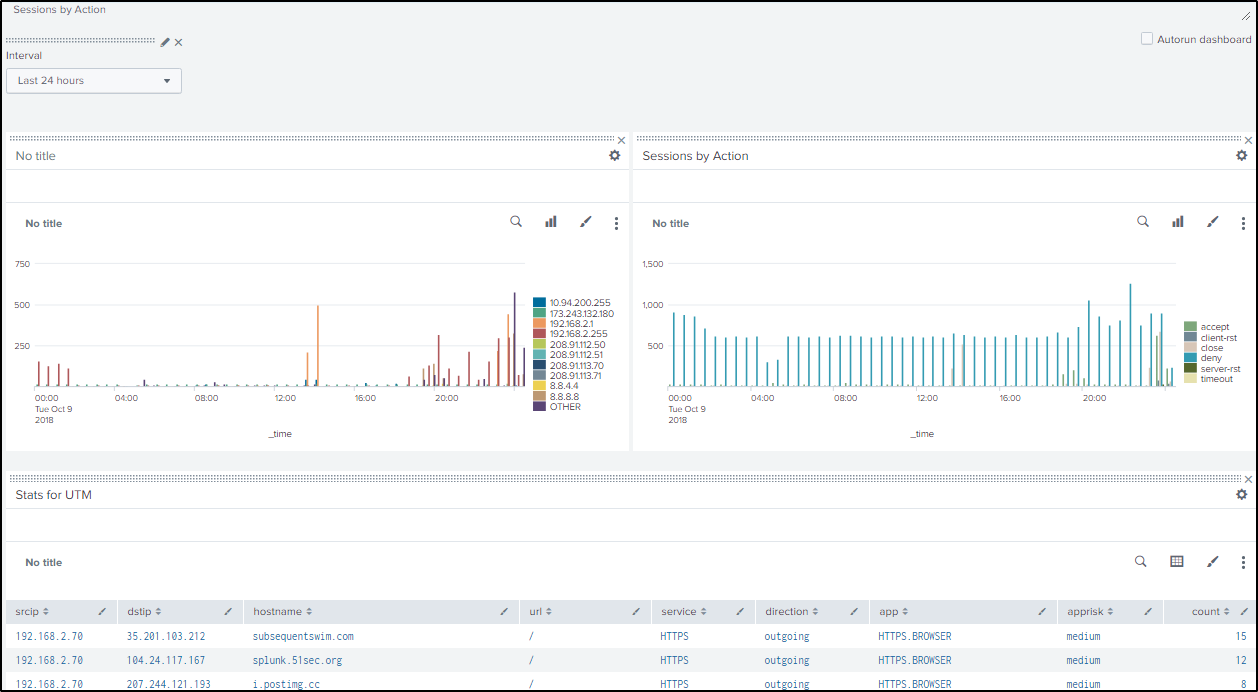
3.1 Traffic Sessions by Destination IP
index="fortigate" srcip=* dstip=* type="traffic" action=* NOT dstip="255.255.255.255" | timechart count by dstip
3.2 Traffic Sessions by Action
index="fortigate" srcip=* dstip=* type="traffic" action=* | timechart count by action
3.3 Statistic for UTM
index="fortigate" OR index=main type=utm | stats count by srcip,dstip,hostname,url,service,direction,app,apprisk | sort -count
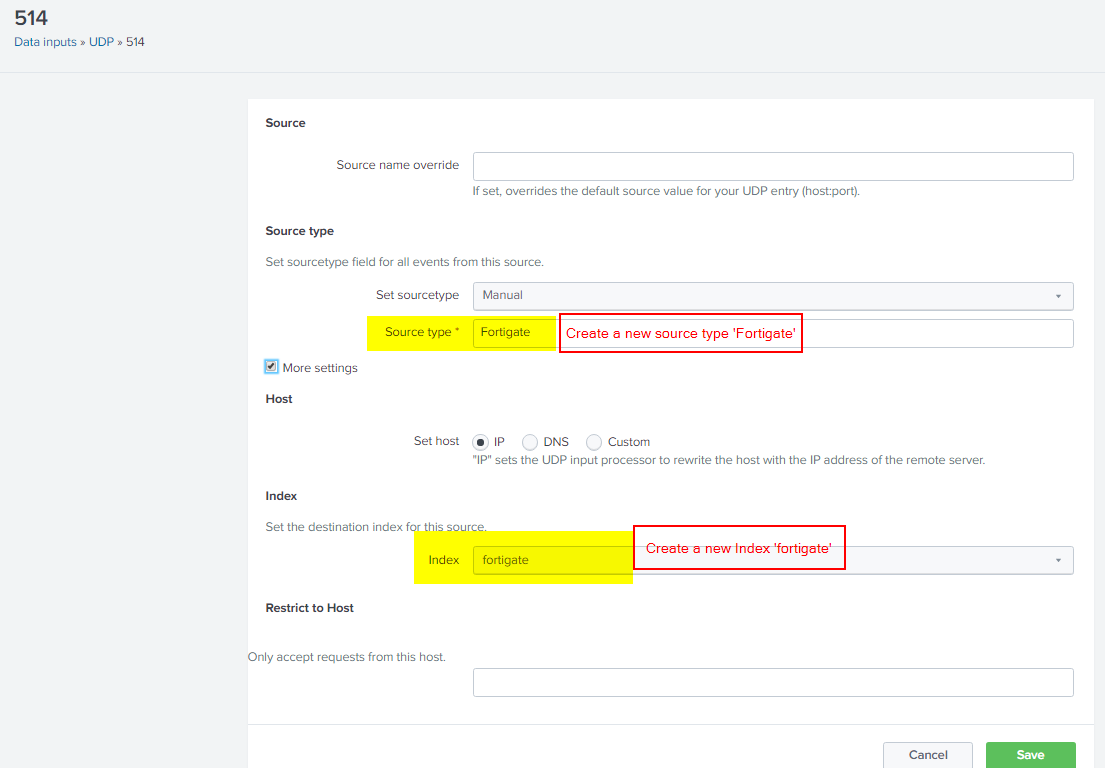
4. New Data Input - UDP 514 for Syslog
5. Reset Splunk to Factory Default
5.1 Clean all eventdata (Database / Indexes)
johnyan_ca@ubuntu:~$ sudo su
root@ubuntu:/home/johnyan_ca# /opt/splunk/bin/splunk stop
Stopping splunkd...
Shutting down.  Please wait, as this may take a few minutes.
..
Stopping splunk helpers...

Done.
root@ubuntu:/home/johnyan_ca# /opt/splunk/bin/splunk clean eventdata
This action will permanently erase all events from ALL indexes; it cannot be undone.
Are you sure you want to continue [y/n]? y
Cleaning database _audit.
Cleaning database _internal.
Cleaning database _introspection.
Cleaning database _telemetry.
Cleaning database _thefishbucket.
Cleaning database fortinet.
Cleaning database history.
Cleaning database main.
Cleaning database summary.
Cleaning database unix_summary.
Cleaning database windows.
Disabled database 'splunklogger': will not clean.
5.2 Remove all apps installed
root@ubuntu:/home/johnyan_ca# cd /opt/splunk/etc/apps/
root@ubuntu:/opt/splunk/etc/apps# ls
SplunkAppForFortinet          alert_webhook                  learned             splunk_gdi
SplunkForwarder               appsbrowser                    legacy              splunk_httpinput
SplunkLightForwarder          eventid                        sample_app          splunk_instrumentation
Splunk_TA_fortinet_fortigate  framework                      search              splunk_monitoring_console
Splunk_TA_linux               gettingstarted                 sh_collectd         user-prefs
Splunk_TA_nix                 introspection_generator_addon  splunk_app_for_nix
alert_logevent                launcher                       splunk_archiver
root@ubuntu:/opt/splunk/etc/apps# rm -rf SplunkAppForFortinet/
root@ubuntu:/opt/splunk/etc/apps# rm -rf Splunk_TA_fortinet_fortigate/
root@ubuntu:/opt/splunk/etc/apps# rm -rf Splunk_TA_linux/
root@ubuntu:/opt/splunk/etc/apps# rm -rf Splunk_TA_nix/
root@ubuntu:/opt/splunk/etc/apps# rm -rf eventid/
root@ubuntu:/opt/splunk/etc/apps# rm -rf splunk_app_for_nix/
If you just want to reset app's configuration, you can use following command to remove local configuration.
/opt/splunk/etc/apps# rm -rf eventid/local/*
Last step is to start splunk application.
root@ubuntu:/opt/splunk/etc/apps# /opt/splunk/bin/splunk start

Splunk> Winning the War on Error

Checking prerequisites...
        Checking http port [80]: open
        Checking mgmt port [8089]: open
        Checking appserver port [127.0.0.1:8065]: open
        Checking kvstore port [8191]: open
        Checking configuration...  Done.
        Checking critical directories...        Done
        Checking indexes...
                Validated: _audit _internal _introspection _telemetry _thefishbucket fortinet history main summary
        Done
        Checking filesystem compatibility...  Done
        Checking conf files for problems...
        Done
        Checking default conf files for edits...
        Validating installed files against hashes from '/opt/splunk/splunk-7.2.0-8c86330ac18-linux-2.6-x86_64-manifest'
        All installed files intact.
        Done
All preliminary checks passed.

Starting splunk server daemon (splunkd)...
Done


Waiting for web server at http://127.0.0.1:80 to be available....... Done


If you get stuck, we're here to help.
Look for answers here: http://docs.splunk.com

The Splunk web interface is at http://ubuntu

root@ubuntu:/opt/splunk/etc/apps#
6. Delete an index data
From GUI, use this command
index="fortinet" | deleteor
index="fortinet" AND sourcetype=Fortigate60D | delete
From command line:
john@ubuntu18:~$ sudo su
[sudo] password for john:
root@ubuntu18:/home/john# cd /opt/splunk/bin
root@ubuntu18:/opt/splunk/bin# ./splunk stop
Stopping splunkd...
Shutting down.  Please wait, as this may take a few minutes.
........
Stopping splunk helpers...

Done.
root@ubuntu18:/opt/splunk/bin# ./splunk clean eventdata -index fortinet -f
Cleaning database fortinet.
root@ubuntu18:/opt/splunk/bin# ./splunk start

Splunk> Be an IT superhero. Go home early.

Checking prerequisites...
        Checking http port [80]: open
        Checking mgmt port [8089]: open
        Checking appserver port [127.0.0.1:8065]: open
        Checking kvstore port [8191]: open
        Checking configuration...  Done.
        Checking critical directories...        Done
        Checking indexes...
                Validated: _audit _internal _introspection _telemetry _thefishbucket fortinet history main summary
        Done
        Checking filesystem compatibility...  Done
        Checking conf files for problems...
        Done
        Checking default conf files for edits...
        Validating installed files against hashes from '/opt/splunk/splunk-7.2.0-8c86330ac18-linux-2.6-x86_64-manifest'
        All installed files intact.
        Done
All preliminary checks passed.

Starting splunk server daemon (splunkd)...
Done


Waiting for web server at http://127.0.0.1:80 to be available... Done


If you get stuck, we're here to help.
Look for answers here: http://docs.splunk.com

The Splunk web interface is at http://ubuntu18

root@ubuntu18:/opt/splunk/bin#
Unfortunately, those commands can not reclaim the space. You will have to wait until those index age timed out.
YouTube Video - 15 Minutes to Configure a Splunk Dashboard for Fortigate Firewalls:
7. Remove Installed APP from Command Line
./splunk display app ./splunk remove app [appname] -auth <username>:<password>
8. Auto Start Splunk when Linux System Reboot
By default, we manual start Splunk after installation.
To change the settings to auto start with system boot, type following command from root login:
[sudo] $SPLUNK_HOME/bin/splunk enable boot-start
You can use pwd to find out your current splunk user location then replace $SPLUNK_HOME. Here is my example:
[root@localhost ~]# /opt/splunk/bin/splunk enable boot-start


![[5 Mins Docker] Deploy FreshRSS Using Docker Run Command and Deploy To Fly.io](https://lh3.googleusercontent.com/blogger_img_proxy/AEn0k_tq4iDisApJ6nunTnpqyHDs9nbvnFV7gKxjAtxDZSwE5YjOUtEou27SIwM1UmQBurzINBHUAIbh321ya_xOiJtO6V-gX7Yqd4HEFWeGJnkg3w)


Nesecito su ayuda para poder configurar mi fortigate app for splunk
ReplyDeleteHi Gpadilla,
DeleteI google translated your comment and found you were asking "I need your help to configure my fortigate app for splunk".
I am not sure what kind of help you will need. Here is my another video to configure Splunk for Fortigate : https://youtu.be/ToAuSf_DXL4
Hi, i going to test splunk for fortigate. But first i have a question:
ReplyDeleteI'm going to use it with 4 fortigate, nothing more be working on splunk. So, i don't know the hardware required for this splunk. Could you help me?
Four fortigates are not that much. Here is recommended configuration for hardware: 2x six-core, 2+ GHz CPU, 12 GB RAM, Redundant Array of Independent Disks (RAID) 0 or 1+0, with a 64 bit OS installed.
DeleteHi Netsec,
ReplyDeleteI tried to configure the dashboard and noticed that the apprisk is not in place as a field and the search query leads to nothing to the threat panel of the Fortinet Network Security tab. Could u please advise how the apprisk field is filtered out of the raw Fortigate UTM logs?
Thanks!
David
Hi David,
DeleteYou might want to re-build your threat panel with your own Query. Here is an example:
type="UTM" AND index="fortinet" AND (apprisk=critical OR apprisk=high OR apprisk=medium OR apprisk=low) | timechart count by apprisk
Hi Netsec.
ReplyDeletefirst thanx for your video , i used fortigate manual and it didn’t help me and then found your video .
I used your config and everything work exactly except threat in overview .
type="UTM" AND index="fortinet" AND (apprisk=critical OR apprisk=high OR apprisk=medium OR apprisk=low) | timechart count by apprisk