YouTube Video:
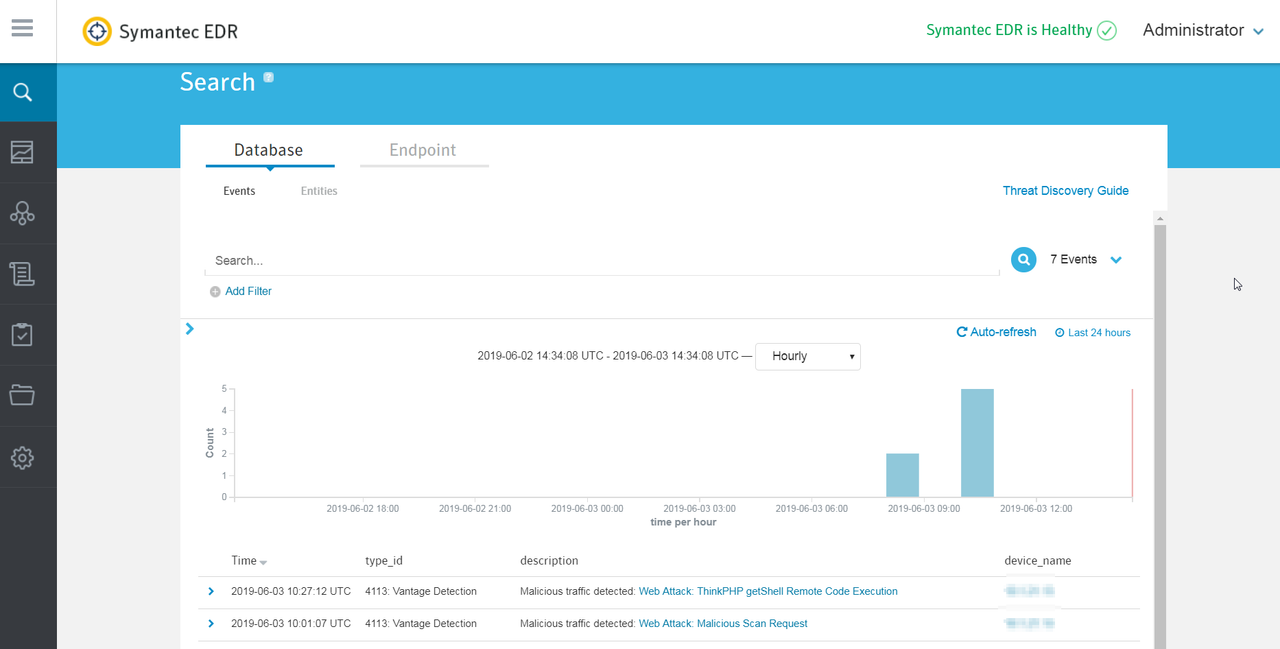
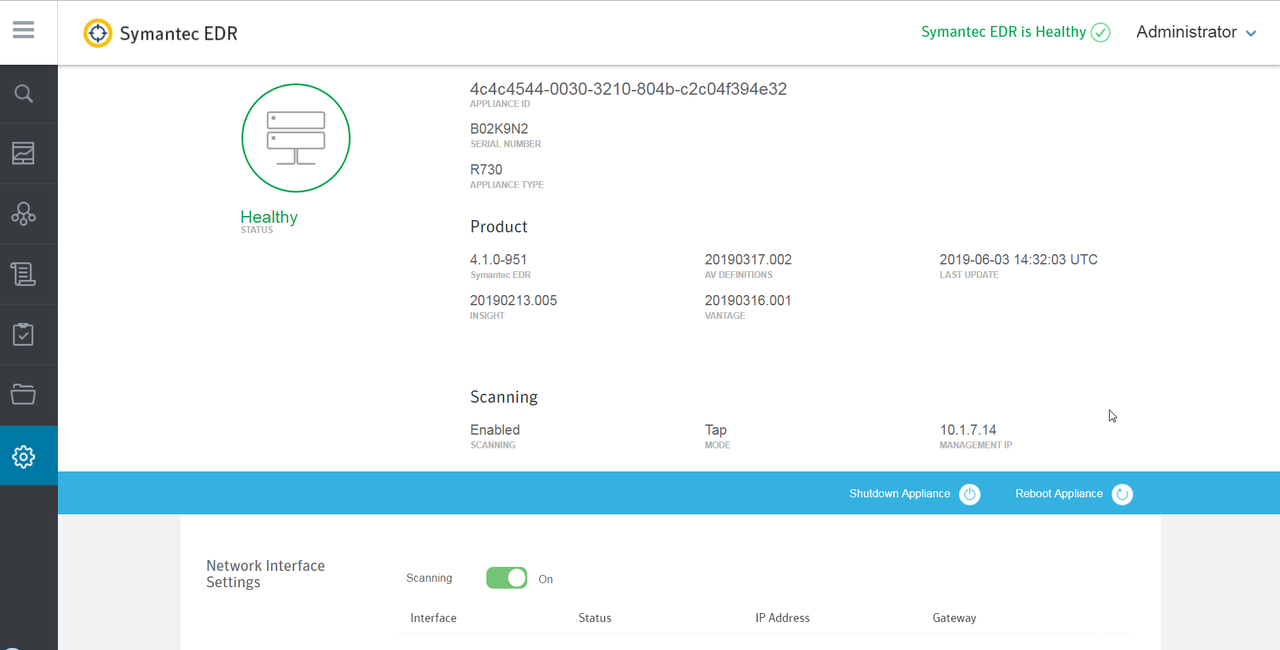
Web GUI
Command Line : Commands
Check Date:
localhost> show --date
Mon Jun 03 13:40:41 GMT 2019
localhost> show
usage: show [--help] [--date] [--version] [--info]
    --help,-h    More extensive help
    --date,-d    Show the current date and time
    --version,-v Show the appliance version number
    --info,-i    Show system information
check Appliance Status:
localhost> status_check
This is the admin tool which verifies the following things.
1) Management Port Status
                                - This verifies if the management port is UP and                                                                                                              Running.
                                This will show 'Active' if its UP and Running,
                                otherwise 'Inactive'.
2) Connection to Symantec
                                - This verifies if the appliance can reach www.s                                                                                                             ymantec.com.
3) Scanner  => Management Server Connectivity
                                - This verifies if the scanner is able to connec                                                                                                             t to the
                                management server or not. On the management serv                                                                                                             er,
                                displays the list of scanners associated with th                                                                                                             e
                                management server. Use this tool on the scanner                                                                                                              to test
                                connectivity between the scanner and the managem                                                                                                             ent server.
4) Service Running
                                - This verifies the status of all services in Sy                                                                                                             mantec EDR. If all
                                services are working properly, 'Success' is retu                                                                                                             rned.
                                Otherwise, process names that are not working pr                                                                                                             operly are
                                displayed.
5) Scanning Status
                                - This verifies if scanning on Symantec EDR is e                                                                                                             nabled or not.
6) Interface Status
                                - This verifies whether interfaces in the curren                                                                                                             t environment
                                are active, such as mgmt_port, wan1_tap1, and la                                                                                                             n1_tap2 in
                                a virtual environment.
                                - This displays traffic received and transmitted                                                                                                              by the
                                active interfaces.
7) Data Inspection Status
                                - This verifies if the packet inspection engine                                                                                                              of Symantec EDR is
                                receiving traffic.
                                - This displays packet processed by the packet i                                                                                                             nspection
                                engine of Symantec EDR.
8) Proxy Server Info
                                - This returns information about the proxy serve                                                                                                             r, if one
                                exists in the management network. This informati                                                                                                             on can be
                                used to test the connectivity to the Symantec se                                                                                                             rvers in
                                the Cloud.
9) Connectivity to Servers
                                - This shows the connectivity to the Symantec se                                                                                                             rvers in the
                                Cloud.

NTP:                                            Synchronised.
Management Port Status:                         Active!
Connection to Symantec:                         Success!
Scanner => Management Server  Connectivity:     The AMQP broker is healthy.
                                                Please use status_check on the s                                                                                                             canners to
                                                test connectvity to the manageme                                                                                                             nt server.
                                                List of connected Scanners is as                                                                                                              below:
                                                172.3.1.13
                                                10.3.1.14
Service Running:                                Success!
Scanning Status:                                This is a management server . Sc                                                                                                             anning status is not applicable for this.
Interface Status:
                                                Interface mgmt_port is active!
                                                Received Bytes= 15.4 MiB  Transm                                                                                                             itted Bytes=34.7 MiB
                                                Interface wan1_tap1 is inactive!
                                                Interface lan1_tap2 is inactive!
                                                Interface wan2_tap3 is inactive!
                                                Interface lan2_tap4 is inactive!
Data Inspection Status:                         This is a management server. Dat                                                                                                             a inspection status is not applicable to this.
Is there a corporate proxy server in the management network? (yes:no)
  no
Connectivity to Servers:
  Accessed Cynic license server [https://licensing.dmas.symantec.com].
  Accessed Cynic API server [https://api.us.dmas.symantec.com].
  Accessed LiveUpdate server [http://liveupdate.symantec.com].
  Accessed AV Detection ping server [https://stnd-avpg.crsi.symantec.com/postDet                                                                                                             ectionEvent].
  Accessed IPS Detection ping server [https://stnd-ipsg.crsi.symantec.com/postIn                                                                                                             trusionEvent].
  Accessed Aztec server [https://register.brightmail.com].
  Accessed Software Update server [https://swupdate.brightmail.com].
  Accessed Insight server [https://shasta-rrs.symantec.com/mrclean].
   Accessed Mobile Insight server [https://shasta-mrs.symantec.com/partner].
  Accessed Roaming and Email Security.Cloud Correlation server [https://datafeedapi.symanteccloud.com].
  Accessed Telemetry: Statistics server [https://stats.norton.com/n/p].
  Accessed Telemetry: File server [https://telemetry.symantec.com].
  Accessed Breach Detection server [https://api-gateway.symantec.com].
  Accessed Symantec EDR Cloud server [https://edrc.symantec.com].
Connectivity to Repository:
  Accessed repository.
localhost>
Enable SSH Access:
localhost> sshconfig enable

Enabling SSH server...Redirecting to /bin/systemctl start sshd.service
done
Enabling SSH server by default (will start at boot)...Note: Forwarding request to 'systemctl enable sshd.service'.
done
localhost>
Check Software Version:
The management server software version has to match scanner version. If not, scanner will not show in the management server's web GUI.
localhost> show --version
Version: 4.1.0-951
Install Date: Mon 25 Mar 2019 01:49:14 PM GMT
localhost>
scanner:
localhost> show --version
Version: 3.1.0-678
Install Date: Mon 03 Jun 2019 01:31:47 PM GMT
localhost>
Update ATP (EDR) to latest version:
- update download
- update status
- update install
localhost> update
Usage: update download|install|list|clean_all|clean_metadata|clean_packages|clea                                                                                                             r_update_state|rpmdb_repair|status
    download:           download latest available version to local cache
    install:            install latest available version from local cache
    list:               list all available versions
    clean_all:          clean up cached packages, metadata and other software up                                                                                                             date data
    clean_metadata:     clean up cached metadata
    clean_packages:     clean up cached packages
    clear_update_state: reset update state
    rpmdb_repair:       repair rpm database.
    clear_lock:         clear out old lockfile
    status:             print current update command status. run 'status_check'                                                                                                              command to check repository access
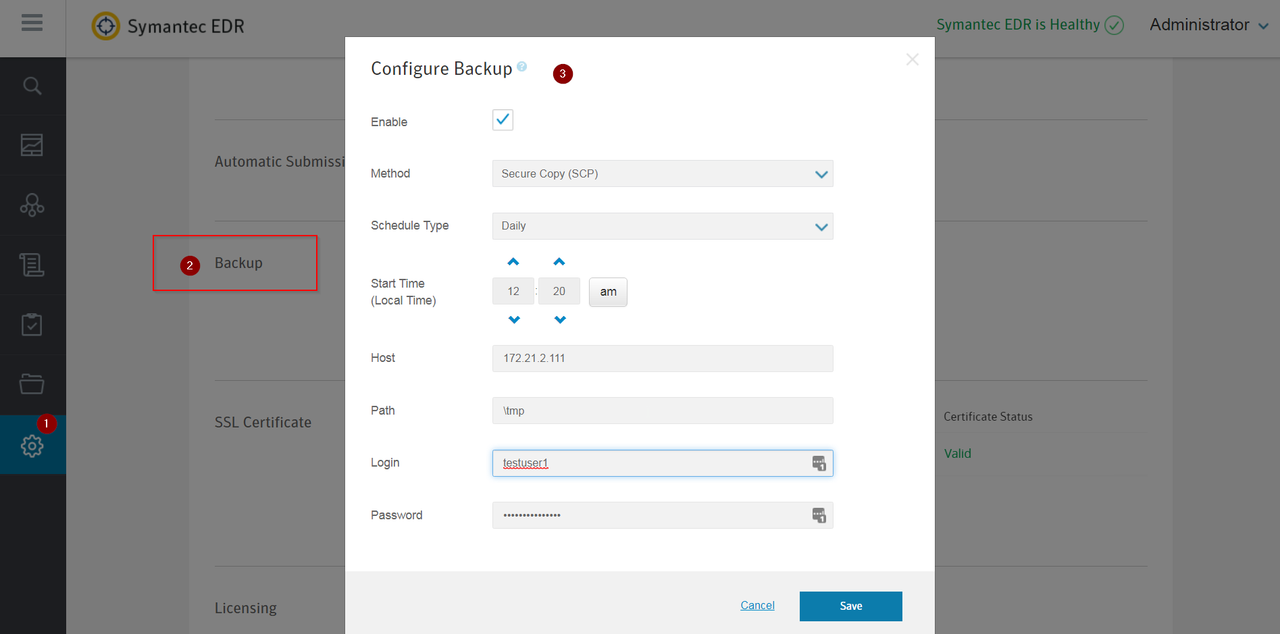
Backup / Restore
From Command Line:
localhost> backup --user=testuser1 --password='password1234' --protocol=scp --port=22 --host=172.21.2.111 --path=/tmp/
2019-06-21 11:30:34,170 INFO Validating remote storage.
2019-06-21 11:30:34,170 INFO index value is None
2019-06-21 11:30:38,395 INFO EDR commands have been backed up successfully
2019-06-21 11:30:38,465 INFO Performing ES snapshot, could take a while...
2019-06-21 11:30:39,955 INFO Done with snapshot.
2019-06-21 11:30:39,955 INFO Snapshot succeeded.
2019-06-21 11:30:39,955 INFO Archiving backup.
2019-06-21 11:30:39,989 INFO Building config_export.txt
2019-06-21 11:30:44,830 INFO Sending backup archive to remote storage via scp.
2019-06-21 11:30:46,317 INFO Succeed running backup, backupfile=sedr_backup_4.1.0-951_20190621113039.tar.gz
localhost>
Troubleshooting
Two errors found recently:1. No Network Traffic is observed on monitored networks in last 24 hours - This usually relates to Switch SPAN port configuration.
2. An error occurred during software update. - This can be resolved by status_check to see which Symantec website is not reachable. It usually relates to your Firewall SSL Decryption.
login as: admin
Pre-authentication banner message from server:
| #######################################################
| # Access is restricted to authorized users.           #
| # If you are logging on to this system in error,      #
| # please log off now.                                 #
| # Unauthorized access will be prosecuted.             #
| #######################################################
End of banner message from server
[email protected]'s password:
     ┌────────────────────────────────────────────────────────────────────┐
     │                        • MobaXterm 12.3 •                          │
     │            (SSH client, X-server and networking tools)             │
     │                                                                    │
     │ ➤ SSH session to [email protected]                                 │
     │   • SSH compression : ✔                                            │
     │   • SSH-browser     : ✔                                            │
     │   • X11-forwarding  : ✘  (disabled or not supported by server)     │
     │   • DISPLAY         : 192.168.2.72:0.0                             │
     │                                                                    │
     │ ➤ For more info, ctrl+click on help or visit our website           │
     └────────────────────────────────────────────────────────────────────┘

Last failed login: Tue Apr 21 15:54:44 GMT 2020 from 10.10.1.4 on ssh:notty
There were 2 failed login attempts since the last successful login.
Last login: Thu Jun 27 13:52:24 2019 from 10.10.13.2
#######################################################
# Access is restricted to authorized users.           #
# If you have logged on to this system in error,      #
# please log off now.                                 #
# Unauthorized access will be prosecuted.             #
#######################################################
localhost>
localhost>
localhost> update status
2020/04/19 02:58:31 UTC : Last software update status - Prepatch failed to apply patch due to errors from proxy.
Next steps:
1.Check the proxy configuration in Symantec EDR  on the Settings -> Appliances page.
2.Then from command line, run 'update download' to try the download again.'
3. If the problem persists, at the command line, run 'gather_logs' command to send information to Symantec support.
localhost> status_check
This is the admin tool which verifies the following things.
1) Management Port Status
                                - This verifies if the management port is UP and Running.
                                This will show 'Active' if its UP and Running,
                                otherwise 'Inactive'.
2) Connection to Symantec
                                - This verifies if the appliance can reach www.symantec.com.
3) Scanner  => Management Server Connectivity
                                - This verifies if the scanner is able to connect to the
                                management server or not. On the management server,
                                displays the list of scanners associated with the
                                management server. Use this tool on the scanner to test
                                connectivity between the scanner and the management server.
4) Service Running
                                - This verifies the status of all services in Symantec EDR. If all
                                services are working properly, 'Success' is returned.
                                Otherwise, process names that are not working properly are
                                displayed.
5) Scanning Status
                                - This verifies if scanning on Symantec EDR is enabled or not.
6) Interface Status
                                - This verifies whether interfaces in the current environment
                                are active, such as mgmt_port, wan1_tap1, and lan1_tap2 in
                                a virtual environment.
                                - This displays traffic received and transmitted by the
                                active interfaces.
7) Data Inspection Status
                                - This verifies if the packet inspection engine of Symantec EDR is
                                receiving traffic.
                                - This displays packet processed by the packet inspection
                                engine of Symantec EDR.
8) Proxy Server Info
                                - This returns information about the proxy server, if one
                                exists in the management network. This information can be
                                used to test the connectivity to the Symantec servers in
                                the Cloud.
9) Connectivity to Servers
                                - This shows the connectivity to the Symantec servers in the
                                Cloud.

NTP:                                            Synchronised.
Management Port Status:                         Active!
Connection to Symantec:                         Success!
Scanner => Management Server  Connectivity:     The AMQP broker is healthy.
                                                Please use status_check on the scanners to
                                                test connectvity to the management server.
                                                List of connected Scanners is as below:
                                                172.2.1.1
                                                10.1.1.14
Service Running:                                Success!
Scanning Status:                                This is a management server . Scanning status is not applicable for this.
Interface Status:
                                                Interface mgmt_port is active!
                                                Received Bytes= 243.1 GiB  Transmitted Bytes=764.0 GiB
                                                Interface wan1_tap1 is inactive!
                                                Interface lan1_tap2 is inactive!
                                                Interface wan2_tap3 is inactive!
                                                Interface lan2_tap4 is inactive!
Data Inspection Status:                         This is a management server. Data inspection status is not applicable to this.
Is there a corporate proxy server in the management network? (yes:no)
no
Connectivity to Servers:
  Accessed Cynic license server [https://licensing.dmas.symantec.com/1/regions].
  Accessed Cynic API server [https://api.global.dmas.symantec.com].
  Accessed LiveUpdate server [http://liveupdate.symantec.com].
  Accessed AV Detection ping server [https://stnd-avpg.crsi.symantec.com/postDetectionEvent].
  Accessed IPS Detection ping server [https://stnd-ipsg.crsi.symantec.com/postIntrusionEvent].
  Accessed Aztec server [https://register.brightmail.com].
  Accessed Software Update server [https://swupdate.brightmail.com].
  Accessed Insight server [https://shasta-rrs.symantec.com/mrclean].
  Accessed Mobile Insight server [https://shasta-mrs.symantec.com/partner].
  Accessed Roaming and Email Security.Cloud Correlation server [https://datafeedapi.symanteccloud.com].
  Accessed Telemetry: Statistics server [https://stats.norton.com/n/p].
  Could not access Telemetry: File server [https://telemetry.symantec.com].
  Accessed Breach Detection server [https://api-gateway.symantec.com].
  Accessed Symantec EDR Cloud server [https://edrc.symantec.com].
Connectivity to Repository:
  Accessed repository.
localhost>
Critical Error Message:
References:
- Basic troubleshooting steps for the ATP
- Best practices for Endpoint Protection on Windows servers
- Choosing which security features to install on the client
- About Application and Device Control policies in Endpoint Protection
- How Host Integrity works
- About Host Integrity requirements
- Setting up Host Integrity
- Creating and testing a Host Integrity policy
- Adding predefined requirements to a Host Integrity policy
- Collect a DSET report - Troubleshooting hardware issue (Dell)
- How to perform tasks from the command line








No comments:
Post a Comment