 The Elastic Stack — formerly known as the ELK Stack — is a collection of open-source software produced by Elastic which allows you to search, analyze, and visualize logs generated from any source in any format, a practice known as centralized logging. Centralized logging can be very useful when attempting to identify problems with your servers or applications, as it allows you to search through all of your logs in a single place. It’s also useful because it allows you to identify issues that span multiple servers by correlating their logs during a specific time frame.
- Elasticsearch: a distributed RESTful search engine which stores all of the collected data.
- Logstash: the data processing component of the Elastic Stack which sends incoming data to Elasticsearch.
- Kibana: a web interface for searching and visualizing logs.
- Beats: lightweight, single-purpose data shippers that can send data from hundreds or thousands of machines to either Logstash or Elasticsearch.
Together, these different components are most commonly used for monitoring, troubleshooting and securing IT environments (though there are many more use cases for the ELK Stack such as business intelligence and web analytics). Beats and Logstash take care of data collection and processing, Elasticsearch indexes and stores the data, and Kibana provides a user interface for querying the data and visualizing it.
Download and Prepare Installation Packages
There are a couple of ways to install ELK stack. One way is to download all packages as show below from online and install them locally. Actually it is not necessary for this post. I am putting all those files here for future references. You can skip this step to next one.https://www.elastic.co/downloads
http://www.oracle.com/technetwork/java/javase/downloads/index.html
- wget https://download.elastic.co/elasticsearch/release/org/elasticsearch/distribution/tar/elasticsearch/2.3.4/elasticsearch-2.3.4.tar.gz
- wget https://download.elastic.co/logstash/logstash/logstash-2.3.4.tar.gz
- wget https://download.elastic.co/kibana/kibana/kibana-4.5.3-linux-x64.tar.gz
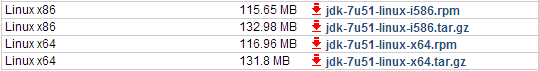
- wget --no-cookies --no-check-certificate --header "Cookie: oraclelicense=accept-securebackup-cookie" https://download.oracle.com/otn-pub/java/jdk/13.0.1+9/cec27d702aa74d5a8630c65ae61e4305/jdk-13.0.1_linux-x64_bin.tar.gz -O jdk-8-linux-x64.tar.gz
For JDK download, you might replace "cec27d702aa74d5a8630c65ae61e4305" with the string you find from Oracle JDK download link.
[root@elk-centos7 ~]# ls -l
total 137456
-rw-r--r--. 1 root root 27547169 May 16 2018 elasticsearch-2.3.4.tar.gz
-rw-r--r--. 1 root root 5307 Mar 20 2012 jdk-8u45-linux-x64.tar.gz
-rw-r--r--. 1 root root 33414498 May 16 2018 kibana-4.5.3-linux-x64.tar.gz
-rw-r--r--. 1 root root 79779303 May 16 2018 logstash-2.3.4.tar.gz
In this post, I am going to show you how to use Yum install all those components without downloading them first.
Prerequisites
- One CentOS 7 server set up by following Initial Server Setup with CentOS 7, including a non-root user with sudo privileges and a firewall. The amount of CPU, RAM, and storage that your Elastic Stack server will require depends on the volume of logs that you intend to gather. For the lab purpose, we will be using a VPS with the following specifications for our Elastic Stack server:
OS: CentOS 7.5
RAM: 4GB
CPU: 2 - Java 8 — which is required by Elasticsearch and Logstash — installed on your server. Note that Java 9 is not supported.
- Nginx installed on your server, which you will configure later in this guide as a reverse proxy for Kibana.
Install JDK & JRE 8
sudo yum install java-1.8.0-openjdksudo yum install java-1.8.0-openjdk-devel
note: https://www.digitalocean.com/community/tutorials/how-to-install-java-on-centos-and-fedora#install-openjdk-8
Install Nginx
sudo yum install epel-releasesudo yum install nginx
sudo systemctl enable nginx
Disable firewall
[opc@Linux-CentOS-7 ~]$ sudo -i
[root@Linux-CentOS-7 ~]# systemctl stop firewalld
[root@Linux-CentOS-7 ~]# systemctl disable firewalld.service
Removed symlink /etc/systemd/system/multi-user.target.wants/firewalld.service.
Removed symlink /etc/systemd/system/dbus-org.fedoraproject.FirewallD1.service.
[root@Linux-CentOS-7 ~]# sudo systemctl mask --now firewalld
Created symlink from /etc/systemd/system/firewalld.service to /dev/null.
[root@Linux-CentOS-7 ~]#
Install ElasticSearch
[root@Linux-CentOS-7 ~]# sudo rpm --import https://artifacts.elastic.co/GPG-KEY-elasticsearch[root@Linux-CentOS-7 ~]# sudo vi /etc/yum.repos.d/elasticsearch.repo
/etc/yum.repos.d/elasticsearch.repo
[elasticsearch-6.x]
name=Elasticsearch repository for 6.x packages
baseurl=https://artifacts.elastic.co/packages/6.x/yum
gpgcheck=1
gpgkey=https://artifacts.elastic.co/GPG-KEY-elasticsearch
enabled=1
autorefresh=1
type=rpm-md
[root@Linux-CentOS-7 ~]# sudo yum install elasticsearch
/etc/elasticsearch/elasticsearch.yml
. . .
network.host: localhost
. . .
Start ElasticSearch
[root@Linux-CentOS-7 ~]# sudo vi /etc/elasticsearch/elasticsearch.yml[root@Linux-CentOS-7 ~]# sudo systemctl start elasticsearch
[root@Linux-CentOS-7 ~]# sudo systemctl enable elasticsearch
Created symlink from /etc/systemd/system/multi-user.target.wants/elasticsearch.service to /usr/lib/systemd/system/elasticsearch.service.
Test ES
[root@Linux-CentOS-7 ~]# curl -X GET "localhost:9200"curl: (7) Failed connect to localhost:9200; Connection refused
Note: If you get this connection refused error, no worries. It might relate to service is not up yet. Give it a minute, you can try it again.
[root@Linux-CentOS-7 ~]# curl -X GET "127.0.0.1:9200"
{
"name" : "9Vq4-ng",
"cluster_name" : "elasticsearch",
"cluster_uuid" : "bOf93iLYSyqRkijrdHLbyw",
"version" : {
"number" : "6.8.3",
"build_flavor" : "default",
"build_type" : "rpm",
"build_hash" : "0c48c0e",
"build_date" : "2019-08-29T19:05:24.312154Z",
"build_snapshot" : false,
"lucene_version" : "7.7.0",
"minimum_wire_compatibility_version" : "5.6.0",
"minimum_index_compatibility_version" : "5.0.0"
},
"tagline" : "You Know, for Search"
}
[root@Linux-CentOS-7 ~]# service nginx restart
Redirecting to /bin/systemctl restart nginx.service
[root@Linux-CentOS-7 ~]# curl -X GET "localhost:9200"
{
"name" : "9Vq4-ng",
"cluster_name" : "elasticsearch",
"cluster_uuid" : "bOf93iLYSyqRkijrdHLbyw",
"version" : {
"number" : "6.8.3",
"build_flavor" : "default",
"build_type" : "rpm",
"build_hash" : "0c48c0e",
"build_date" : "2019-08-29T19:05:24.312154Z",
"build_snapshot" : false,
"lucene_version" : "7.7.0",
"minimum_wire_compatibility_version" : "5.6.0",
"minimum_index_compatibility_version" : "5.0.0"
},
"tagline" : "You Know, for Search"
}
[root@Linux-CentOS-7 ~]# netstat -tunnpl
Active Internet connections (only servers)
Proto Recv-Q Send-Q Local Address Foreign Address State PID/Program name
tcp 0 0 127.0.0.1:25 0.0.0.0:* LISTEN 2842/master
tcp 0 0 0.0.0.0:111 0.0.0.0:* LISTEN 1/systemd
tcp 0 0 0.0.0.0:80 0.0.0.0:* LISTEN 12181/nginx: master
tcp 0 0 0.0.0.0:22 0.0.0.0:* LISTEN 3139/sshd
tcp6 0 0 ::1:25 :::* LISTEN 2842/master
tcp6 0 0 :::111 :::* LISTEN 1/systemd
tcp6 0 0 ::1:9200 :::* LISTEN 12526/java
tcp6 0 0 127.0.0.1:9200 :::* LISTEN 12526/java
tcp6 0 0 :::80 :::* LISTEN 12181/nginx: master
tcp6 0 0 ::1:9300 :::* LISTEN 12526/java
tcp6 0 0 127.0.0.1:9300 :::* LISTEN 12526/java
tcp6 0 0 :::22 :::* LISTEN 3139/sshd
udp 0 0 0.0.0.0:68 0.0.0.0:* 2521/dhclient
udp 0 0 0.0.0.0:111 0.0.0.0:* 1/systemd
udp 0 0 127.0.0.1:323 0.0.0.0:* 2050/chronyd
udp 0 0 0.0.0.0:927 0.0.0.0:* 2028/rpcbind
udp6 0 0 :::111 :::* 1/systemd
udp6 0 0 ::1:323 :::* 2050/chronyd
udp6 0 0 :::927 :::* 2028/rpcbind
[root@Linux-CentOS-7 ~]#
Install and Start Kibana
sudo yum install kibanasudo systemctl enable kibana
sudo systemctl start kibana
Config Kibana
First, use theopenssl command to create an administrative Kibana user which you’ll use to access the Kibana web interface. echo "kibanaadmin:`openssl passwd -apr1`" | sudo tee -a /etc/nginx/htpasswd.users
Next, we will create an Nginx server block file. As an example, we will refer to this file as
elk.confsudo vi /etc/nginx/conf.d/elk.confThis code configures Nginx to direct your server’s HTTP traffic to the Kibana application, which is listening on localhost:5601. Additionally, it configures Nginx to read the htpasswd.users file and require basic authentication.150.136.225.194 is the public ip for your ELK VM. If you donot have FQDN, you can use public ip for Ngnix to listen your this ELK website.
elk.conf’>/etc/nginx/conf.d/elk.conf
server {
    listen 80;

    server_name 150.136.225.194;

    auth_basic "Restricted Access";
    auth_basic_user_file /etc/nginx/htpasswd.users;

    location / {
        proxy_pass http://localhost:5601;
        proxy_http_version 1.1;
        proxy_set_header Upgrade $http_upgrade;
        proxy_set_header Connection 'upgrade';
        proxy_set_header Host $host;
        proxy_cache_bypass $http_upgrade;
    }
}
Test Kibana
sudo nginx -t
sudo systemctl restart nginx
By default, SELinux security policy is set to be enforced. Run the following command to allow Nginx to access the proxied service:
sudo setsebool httpd_can_network_connect 1 -P
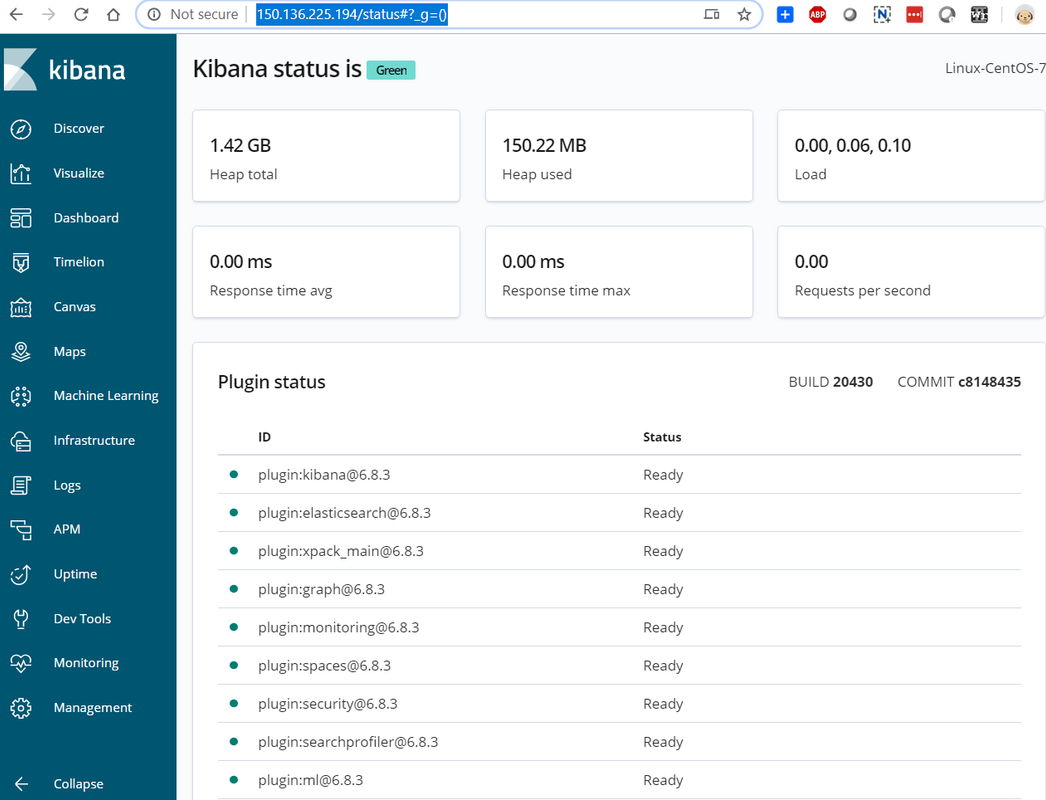
http://150.136.225.194/status
It will prompt you a window to ask your username and password. Username is the one we configured before: kibanaadmin
Install Logstash
sudo yum install logstash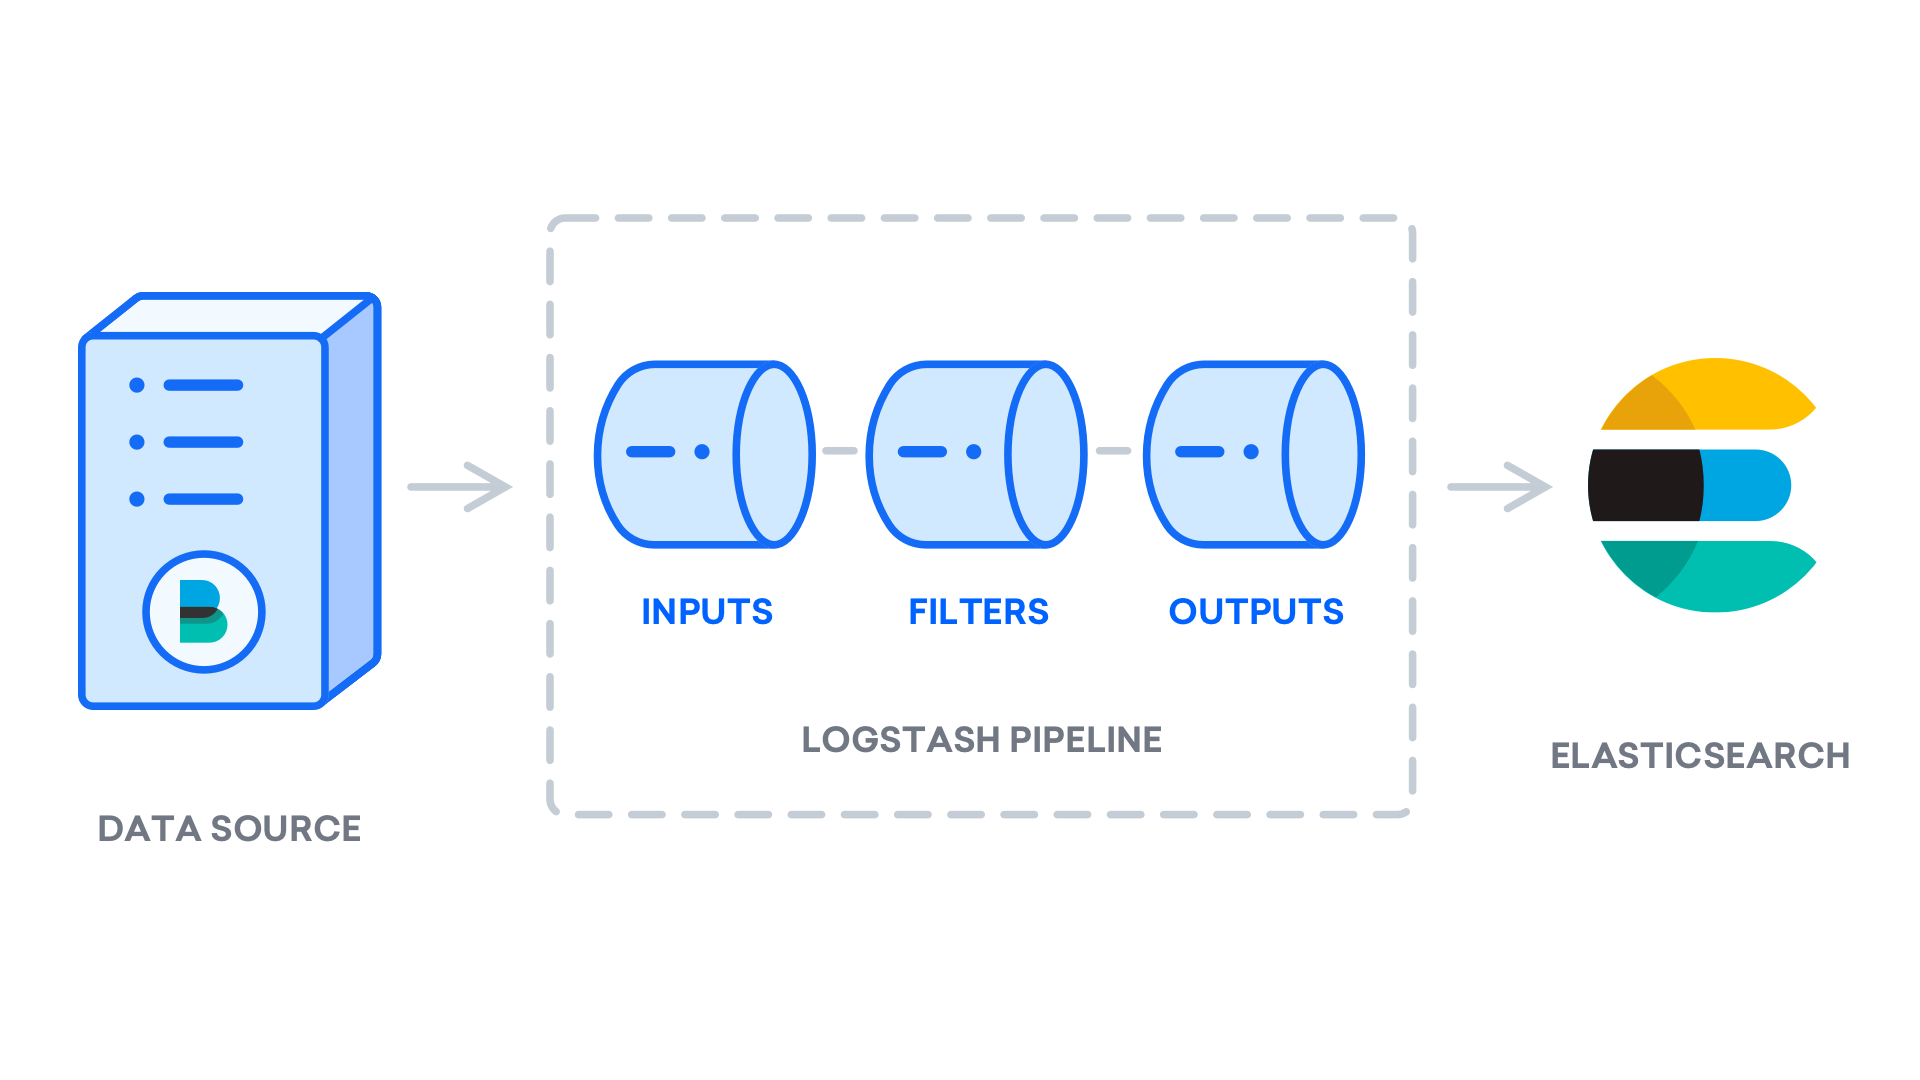
Config Logstash
Create a configuration file called 02-beats-input.conf where you will set up your Filebeat input:sudo vi /etc/logstash/conf.d/02-beats-input.conf
Insert the following input configuration. This specifies a beats input that will listen on TCP port 5044.
/etc/logstash/conf.d/02-beats-input.conf
input {
  beats {
    port => 5044
  }
}
Next, create a configuration file called 10-syslog-filter.conf, which will add a filter for system logs, also known as syslogs:
sudo vi /etc/logstash/conf.d/10-syslog-filter.conf
[root@Linux-CentOS-7 ~]# sudo vi /etc/logstash/conf.d/10-syslog-filter.conf
/etc/logstash/conf.d/10-syslog-filter.conf
filter {
  if [fileset][module] == "system" {
    if [fileset][name] == "auth" {
      grok {
        match => { "message" => ["%{SYSLOGTIMESTAMP:[system][auth][timestamp]} %{SYSLOGHOST:[system][auth][hostname]} sshd(?:\[%{POSINT:[system][auth][pid]}\])?: %{DATA:[system][auth][ssh][event]} %{DATA:[system][auth][ssh][method]} for (invalid user )?%{DATA:[system][auth][user]} from %{IPORHOST:[system][auth][ssh][ip]} port %{NUMBER:[system][auth][ssh][port]} ssh2(: %{GREEDYDATA:[system][auth][ssh][signature]})?",
                  "%{SYSLOGTIMESTAMP:[system][auth][timestamp]} %{SYSLOGHOST:[system][auth][hostname]} sshd(?:\[%{POSINT:[system][auth][pid]}\])?: %{DATA:[system][auth][ssh][event]} user %{DATA:[system][auth][user]} from %{IPORHOST:[system][auth][ssh][ip]}",
                  "%{SYSLOGTIMESTAMP:[system][auth][timestamp]} %{SYSLOGHOST:[system][auth][hostname]} sshd(?:\[%{POSINT:[system][auth][pid]}\])?: Did not receive identification string from %{IPORHOST:[system][auth][ssh][dropped_ip]}",
                  "%{SYSLOGTIMESTAMP:[system][auth][timestamp]} %{SYSLOGHOST:[system][auth][hostname]} sudo(?:\[%{POSINT:[system][auth][pid]}\])?: \s*%{DATA:[system][auth][user]} :( %{DATA:[system][auth][sudo][error]} ;)? TTY=%{DATA:[system][auth][sudo][tty]} ; PWD=%{DATA:[system][auth][sudo][pwd]} ; USER=%{DATA:[system][auth][sudo][user]} ; COMMAND=%{GREEDYDATA:[system][auth][sudo][command]}",
                  "%{SYSLOGTIMESTAMP:[system][auth][timestamp]} %{SYSLOGHOST:[system][auth][hostname]} groupadd(?:\[%{POSINT:[system][auth][pid]}\])?: new group: name=%{DATA:system.auth.groupadd.name}, GID=%{NUMBER:system.auth.groupadd.gid}",
                  "%{SYSLOGTIMESTAMP:[system][auth][timestamp]} %{SYSLOGHOST:[system][auth][hostname]} useradd(?:\[%{POSINT:[system][auth][pid]}\])?: new user: name=%{DATA:[system][auth][user][add][name]}, UID=%{NUMBER:[system][auth][user][add][uid]}, GID=%{NUMBER:[system][auth][user][add][gid]}, home=%{DATA:[system][auth][user][add][home]}, shell=%{DATA:[system][auth][user][add][shell]}$",
                  "%{SYSLOGTIMESTAMP:[system][auth][timestamp]} %{SYSLOGHOST:[system][auth][hostname]} %{DATA:[system][auth][program]}(?:\[%{POSINT:[system][auth][pid]}\])?: %{GREEDYMULTILINE:[system][auth][message]}"] }
        pattern_definitions => {
          "GREEDYMULTILINE"=> "(.|\n)*"
        }
        remove_field => "message"
      }
      date {
        match => [ "[system][auth][timestamp]", "MMM  d HH:mm:ss", "MMM dd HH:mm:ss" ]
      }
      geoip {
        source => "[system][auth][ssh][ip]"
        target => "[system][auth][ssh][geoip]"
      }
    }
    else if [fileset][name] == "syslog" {
      grok {
        match => { "message" => ["%{SYSLOGTIMESTAMP:[system][syslog][timestamp]} %{SYSLOGHOST:[system][syslog][hostname]} %{DATA:[system][syslog][program]}(?:\[%{POSINT:[system][syslog][pid]}\])?: %{GREEDYMULTILINE:[system][syslog][message]}"] }
        pattern_definitions => { "GREEDYMULTILINE" => "(.|\n)*" }
        remove_field => "message"
      }
      date {
        match => [ "[system][syslog][timestamp]", "MMM  d HH:mm:ss", "MMM dd HH:mm:ss" ]
      }
    }
  }
}
Lastly, create a configuration file called 30-elasticsearch-output.conf:
sudo vi /etc/logstash/conf.d/30-elasticsearch-output.conf[root@Linux-CentOS-7 ~]# sudo vi /etc/logstash/conf.d/30-elasticsearch-output.conf
/etc/logstash/conf.d/30-elasticsearch-output.conf
output {
  elasticsearch {
    hosts => ["localhost:9200"]
    manage_template => false
    index => "%{[@metadata][beat]}-%{[@metadata][version]}-%{+YYYY.MM.dd}"
  }
}
Test your Logstash configuration with this command:
sudo -u logstash /usr/share/logstash/bin/logstash --path.settings /etc/logstash -t
If there are no syntax errors, your output will display
Configruation OK after a few seconds. [root@Linux-CentOS-7 ~]# sudo -u logstash /usr/share/logstash/bin/logstash --path.settings /etc/logstash -t
Sending Logstash logs to /var/log/logstash which is now configured via log4j2.properties
[2019-10-22T01:45:28,603][INFO ][logstash.setting.writabledirectory] Creating directory {:setting=>"path.queue", :path=>"/var/lib/logstash/queue"}
[2019-10-22T01:45:28,625][INFO ][logstash.setting.writabledirectory] Creating directory {:setting=>"path.dead_letter_queue", :path=>"/var/lib/logstash/dead_letter_queue"}
Configuration OK
[2019-10-22T01:45:37,738][INFO ][logstash.runner ] Using config.test_and_exit mode. Config Validation Result: OK. Exiting Logstash
[root@Linux-CentOS-7 ~]#
sudo systemctl start logstash
sudo systemctl enable logstash
Installing and Configuring Filebeat
The Elastic Stack uses several lightweight data shippers called Beats to collect data from various sources and transport them to Logstash or Elasticsearch. Here are the Beats that are currently available from Elastic:
- Filebeat: collects and ships log files.
- Metricbeat: collects metrics from your systems and services.
- Packetbeat: collects and analyzes network data.
- Winlogbeat: collects Windows event logs.
- Auditbeat: collects Linux audit framework data and monitors file integrity.
- Heartbeat: monitors services for their availability with active probing.
sudo vi /etc/filebeat/filebeat.yml
/etc/filebeat/filebeat.yml
...
#output.elasticsearch:
  # Array of hosts to connect to.
  #hosts: ["localhost:9200"]
...
/etc/filebeat/filebeat.yml
output.logstash:
  # The Logstash hosts
  hosts: ["localhost:5044"]
sudo filebeat modules enable system
sudo filebeat modules list
sudo filebeat setup --template -E output.logstash.enabled=false -E 'output.elasticsearch.hosts=["localhost:9200"]'
sudo filebeat setup -e -E output.logstash.enabled=false -E output.elasticsearch.hosts=['localhost:9200'] -E setup.kibana.host=localhost:5601
sudo systemctl start filebeat
sudo systemctl enable filebeat
curl -X GET 'http://localhost:9200/filebeat-*/_search?pretty'
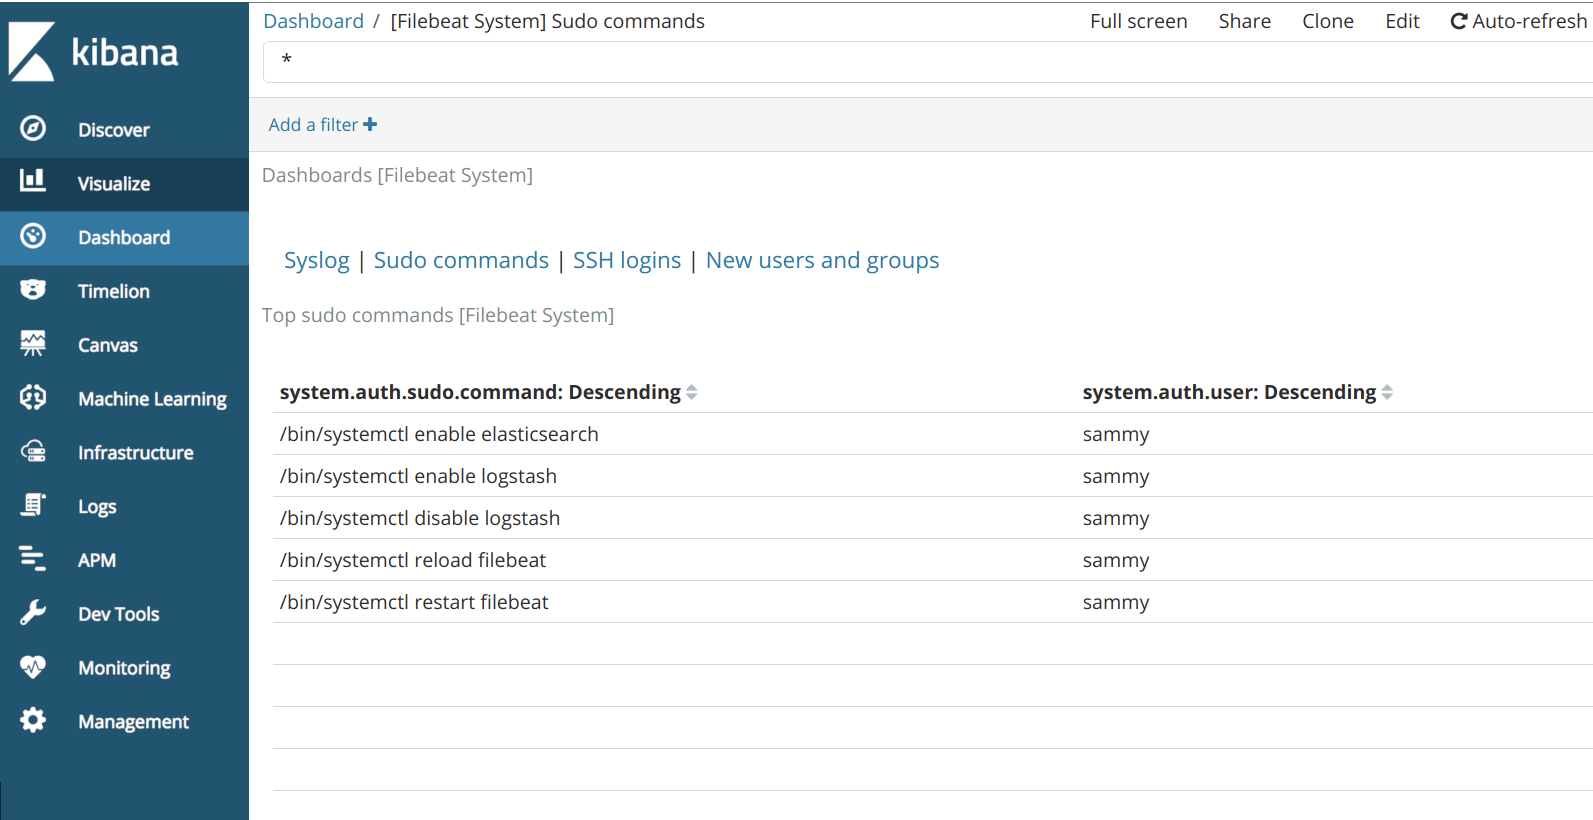
Exploring Kibana Dashboards


No comments:
Post a Comment