Guardium Project Overview
The project scope is to implement the IBM InfoSphere Guardium V11 VM appliances by utilizing the Guardium Installation Manager (GIM) to setup and monitor privileged user activities at ITProSec Toronto data center. During the course of the implementation we completed the following tasks:

- ü How to install Guardium
Collector and central manager?
- ü How to deploy GIM, STAPS etc.
for deployment
- ü How to create Policies, reports etc. for monitoring
- ü Any IBM Guardium links,
tuning steps, troubleshooting steps
- ü Identified and reviewed Guardium POC implementation and related policies, activities and reports run on the database servers in the project scope
- ü Define UAT, Development & Production systems
o
Create
architecture for each environment.
o
Oracle database
servers on IBM AIX PSeries Servers
o
Database servers
on network segregated location
- ü
Assisted with
network considerations to setup and configure the VM machines.
o
Database servers
on network segregated system
o
Build Collectors
& Central Manager/Aggregators (CM/Agg). (See, Appliance Specifications)
- ü
Reviewed and established
database monitoring requirements
o
Long term storage
media and format.
o
Guardium Discovery
and Classification was installed for future scans.
- ü
Installed and
configured Guardium Collectors, Guardium CM/Agg.
o
Production environment
was implemented with # Collectors & # CM/Agg. (# primary & #fail over).
o
Test/UAT
environment was implemented with # Collectors and # CM/Agg.
o
# CM/Agg is stand
alone Reporting Facility
- ü Installed and configured GIM, S-TAP agents and inspection engines for the database servers in the scope.
- ü Hold Monitoring Planning Sessions
o
Created User
Groups based on 51Test requirements planning session.
o
Created a System
Policies based on 51Test requirements planning
session.
o
Created a Reports
based on 51Test requirements planning session
- ü Created system alerts based on 51Test criteria collected during the planning session
ü Verified all reports, alerts and audit processes.


In the past, data protection programs were compliance focused and tactical. After years of headlines, breaches, and damaged customer confidence, security has now taken on a strategic data-centric focus.
DP Maturity Level
The journey follows a maturity model. The IBM Database Audit and Protection Maturity Model follows the structure of the following capability maturity model index. The model provides the basis for organizations to identify gaps for improving the data security environment such as incorporating updated specifications for controls, processes, policies and procedures, and implementing new solutions or improvements to existing ones.

Best Practice
Infrastructure Best Practices:
- Document the Deployment and changes: It’s important to document the initial design decisions as well as changes to them as the system and processes mature. Good documentation is essential to maintaining continuity as staff turnover occurs
- Create and document processes for patches and upgrades
- Guardium provides agent-based and agent-less architecture for monitoring of database assets. Agents support multiple operating systems over the variety of databases and their versions. A clear communication is needed between the IT, DBA and Security teams so that changes / updates to the databases and underlying OSes do not disrupt Guardium operations
- Consistent repeatable processes for patching and upgrades ensures smooth continuous operation of Guardium components
- Upgrades offer opportunities to improve with new features and functionalities
- Create and maintain runbooks to provide consistent operations
- Automate Where Possible to reduce operational overhead so that instead of ‘just keeping the lights on’, staff can focus on higher level tasks like compliance and security policy development and monitoring/managing security alerts
- Communication plan: There must be a strong communication plan between all Business/App Owners, IT Ops, DB Ops and Sec Ops teams.
In the past, data protection programs were compliance focused and tactical. After years of headlines, breaches, and damaged customer confidence, security has now taken on a strategic data-centric focus.
Traditional Compliance
|
Modern Security
| |
Mindset
|
|
|
Drivers
|
|
|
DP Maturity Level
The journey follows a maturity model. The IBM Database Audit and Protection Maturity Model follows the structure of the following capability maturity model index. The model provides the basis for organizations to identify gaps for improving the data security environment such as incorporating updated specifications for controls, processes, policies and procedures, and implementing new solutions or improvements to existing ones.
Database security and lifecycle
Regulatory
compliance and auditing is only one aspect of database monitoring the database.
A complete data security solution considers security monitoring challenges,
setting the monitoring goals, data security lifecycle, and infrastructure
constraints DAM goes through a lifecycle which includes:
LifeCyber Example 1:
LifeCyber Example 1:

2. Data Discovery & Classifcation ( DP Owner, Developers, Business Data Owners)
3. Vulnerability Assessments (DP Owner, System Admin(s), DB Admin(s)
4. DB Activity Monitoring ( DP Owner, SOC Operations, SIEM Operations, Compliance)
5. Blocking (DP Owner, Business Data Owner, Database Administrators)
6. Analytics (DP Owner, Risk, Compliance)
LifeCycle Example 2:
1. Find your sensitive data
In many
organizations, it is difficult to know where the sensitive data is located.
This is a task that must be automated because the environment is constantly
changing as data moves to new databases and unstructured data stores such as
HADOOP. To know where your sensitive information is located at any one point of
time, you must repeatedly scan for this type of information on a continuous
basis.
2. Monitor
After
you know where your sensitive data is located, you can set appropriate monitoring
and security controls to identify who has been accessing this information. For
example, Payment Card Industry (PCI) requirement 10.2.1requires you to verify
that all individual access to cardholder data is logged.
3. Analyze
Analyze
your environment to understand where gaps are in your security policies. In
today’s virtualized world, resources can be quickly allocated and deployed to
meet the business needs. It is critical to analyze the data that these new
applications embed into your infrastructure. This analysis helps drive the audit
requirements to achieve compliance and security controls for these new
applications.
4. Audit
Audit is
used to validate your processes and procedures to achieve your security goals
and identify gaps in the current processes. These goals should include validating
the reliability of the information collected; change control processes are in
effect; exception reporting is identified and working; archiving and restoring
audit data for forensic events; and so on.
5. Assess
Assess
your current environment to identify missing patches or configuration issues
with your servers. Assess how database infrastructure is being used. For
example, is there a security risk because individuals are sharing credentials?
Is there a strong password policy in place? After assessing your environment,
you must remediate the found issues.
6. Harden
Harden
the environment means to close the gaps identified during the assessment phase.
For example, we have identified that there is no strong password policy in
place to login to the database. During the harden phase, this is corrected.
After all of the gaps are remediated, you can tighten up your security policy.
7. Enforce
Enforce
means to proactively identify security policies to alert and potentially block
access to unauthorized resources. For example, if the only connection to the
database is coming from the application server (10.10.10.10), then you can
write a security policy to prevent any access from IP Addresses other than
10.10.10.10. This helps secure your environment from known and unknown attacks
that are launched from unknown connections (everything other than 10.10.10.10).Architecture components
From the architecture view, IBM InfoSphere Guardium components can be grouped
into appliance and agent:
Appliances
· Collectors: The collector is the appliance used for real-time capture and analysis of the database activity.· Aggregators: The aggregator appliance is used to off-load reporting activity from the collectors, and to provide consolidated reporting from multiple collectors.
· Central Managers: The central manager (CM) is specialized functionality enabled on an aggregator appliance. The central manager function is used to manage and control multiple Guardium appliances,
· Software TAP agent (S-TAP®): The S-TAP agent is installed on the database server and is used to monitor and relay the observed activity to the Guardium collector appliance.
· Guardium Installation Manager Agent (GIM): The GIM agent is installed on the database server and is used to facilitate agent installation, update, and configuration modification of agents.
· Change Audit System agent (CAS): The CAS agent is installed on the database server and is used to capture change audit information of configuration files and more on the database server.
· Instance Discovery agent: The instance discovery agent is installed on the database server and is used to obtain database, listener, and port information.
The central manager (CM) is specialized functionality enabled on an
aggregator appliance. The central manager function is used to manage and
control multiple Guardium appliances, referred to as a managed environment.
This function provides patch installation, software updates, and the
configuration of queries, reports, groups, users, policies, and so on. There
can only be one primary CM in a managed environment. In small environments, the
aggregator appliance typically serves as both an aggregator and the CM. Whereas
in larger environments, the CM runs on an aggregator, which does not perform
aggregation, that is, does not receive data from collectors, referred to as a
dedicated CM.
Central management
Central
Manager is the Guardium appliance that monitor and control other Guardium units
in a federated environment. Unmanaged Guardium appliances are referred to as
stand-alone units.
Smooth
and efficient operation of Central Manager unit is critical to the overall Guardium
system performance. This section describes considerations about Central Manager
efficiency and maintenance.
Guardium definitions
Central
Manager houses most of the definitions of all the units that report to it. When
users submit any report, query, or audit process on any managed unit in a federated
(centrally managed) environment, definitions of this activity are retrieved
directly from Central Manager. Therefore, latency between Central Manager and
its managed units can be a contributing factor for potential user interface
slowness on the corresponding managed units. Users can use either Central
Manager or any of its managed units to modify those definitions. Regardless of
the appliance where the definition changes were made, updated content (with an
exceptions of Policies and Groups) is immediately available on all the
appliances across the federated environment.
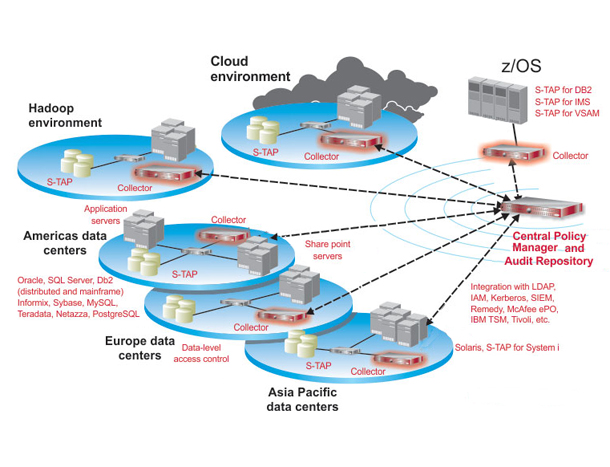
Enterprise architecture
CLIENT
implementation represents an enterprise architecture for monitoring a numerous
databases across multiple data centers and continents. This architecture
example consists of many collector appliances and numerous S-TAP agents
installed on mainframe and distributed database servers across data centers.
The S-TAP agents are configured to capture and send the relevant database
activities to the Guardium collectors for analysis, parsing, and logging. The
collectors are configured to aggregate activities monitored to the respective aggregator
appliance for central reporting. A dedicated Central Manager appliance provides
federated management capabilities such as access management, patching, metadata
repository, and more.
Appliance types
The Guardium appliance is deployed in one of two types - collector or aggregator. An aggregator can additionally be designated a Central Manger.
The collector is the workhorse appliance in the Guardium DAM solution and is used for real-time capture and analysis of the database activity. The collector receives and processes monitored-traffic in real-time from the S-TAP agents deployed on the database servers. Think of the collector as a transaction processing system, with potentially high disk I/O, where the “transactions” are the database-user activity being monitored.
The aggregator appliance is used to off-load reporting activity from the collectors, and to provide consolidated reporting from multiple collectors. The aggregator does not collect data from S-TAPs but receives the data from the collectors in a nightly batch file.
The aggregator is optional but recommended if several collectors are deployed. While not typical, an aggregator can receive data from other aggregators to provide enterprise-wide report. This is referred to as second-level aggregation.
Features
Central management
Central
Manager is the Guardium appliance that monitor and control other Guardium units
in a federated environment. Unmanaged Guardium appliances are referred to as
stand-alone units.
Smooth
and efficient operation of Central Manager unit is critical to the overall Guardium
system performance. This section describes considerations about Central Manager
efficiency and maintenance.
Central Manager houses most of the definitions of all the units that report to it. When users submit any report, query, or audit process on any managed unit in a federated (centrally managed) environment, definitions of this activity are retrieved directly from Central Manager. Therefore, latency between Central Manager and its managed units can be a contributing factor for potential user interface slowness on the corresponding managed units. Users can use either Central Manager or any of its managed units to modify those definitions. Regardless of the appliance where the definition changes were made, updated content (with an exceptions of Policies and Groups) is immediately available on all the appliances across the federated environment.
Enterprise architecture
 CLIENT implementation represents an enterprise architecture for monitoring a numerous databases across multiple data centers and continents. This architecture example consists of many collector appliances and numerous S-TAP agents installed on mainframe and distributed database servers across data centers. The S-TAP agents are configured to capture and send the relevant database activities to the Guardium collectors for analysis, parsing, and logging. The collectors are configured to aggregate activities monitored to the respective aggregator appliance for central reporting. A dedicated Central Manager appliance provides federated management capabilities such as access management, patching, metadata repository, and more.
Failover
S-TAP configuration option:
In
this configuration, the S-TAP is configured to register with multiple
collectors, but only send traffic to one collector at a time. S-tap in this configuration
sends all its traffic to one collector unless it encounters connectivity issues
to that collector that triggers a failover to a secondary collector as
configured. This is the most widely used S-TAP configuration to date.
Audit level
To
determining the amount of data the solution will be processing and logging, you
must understand your general audit requirements that then are translated to the
audit levels. Audit levels are used as the guidelines for the amounts of data expected
to be processed.
Privileged user audit
Audit
only specific users and ignore all other connections; the audited users should
be a finite list of non-application users (meaning – real people, and not application
traffic); In this mode, S-TAP filters many of the sessions and only a small
subset of the overall traffic is sent to the Guardium appliance (filtering is done
on the session level by S-TAP).
Sensitive object audit
This is
also know as “selective audit” that audits only specific database activity; a
finite list of sensitive objects, and a finite list of SQL commands (for example,
only DDL commands); in this mode, S-TAP sends all the traffic to the collector
and the collector inspects all SQL statements and determines whether it is
relevant.
Database activity monitoring
Database
activity monitoring is the ability to monitor and audit activities into and out
of the database server. These events are typically SQL events such as Select,
Insert, Update, Delete, Drop, Create, and Alter. However, Database Activity
Monitoring has evolved over the years to include more items than just the “activity”
into the database. As described auditing requirements, these other areas are
important in database activity monitoring as well:
·
Blocking capabilities to prevent unauthorized
access
·
Data discovery and classification to help you
locate sensitive data
·
Importing external information to enrich the
audit reports
·
Identifying the “application user” from a
pooled database user connection
Monitoring
entitlement reports to identify privilege users and high risk accounts that
have elevated privileges to sensitive data. Vulnerability assessment to
identify gaps in the configuration of the database Server
Vulnerability assessment
Vulnerability
assessment (VA) is a critical process in the security of database servers. VA
is the process of identifying three types of potential issues:
·
Database tier issues
·
Operating system (OS) tier issues
·
Database user activity in how they are using
the database issues
Figure
4-7 shows three types of vulnerability assessment categories. Each one of these
categories helps identify potential issues that should be resolved through your
audit processes.
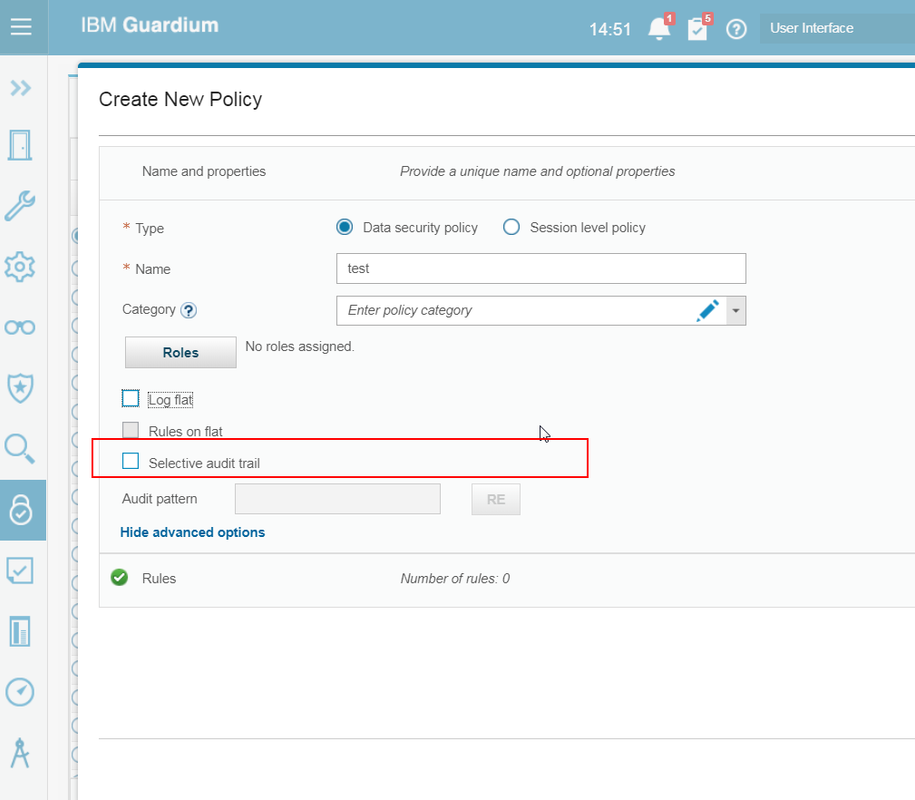
Policy
Two (2) Policy Types and Three (3)
Policy Rules:
Guardium has two Policy Types:
Non-selective: A non-selective policy logs the following:
· All the client to server access traffic is logged into the collector with minimum granularity.· All the database exceptions are logged.
· Server to client result sets that have explicit policy rules specified to log.
Selective: A selective policy logs the following:
· Database exceptions· Client to server access that has explicit policy rules specified to log
· Server to client result sets that have explicit policy rules specified to log
Following figure shows the configuration panel where the selective or the non-selective policy type is defined.
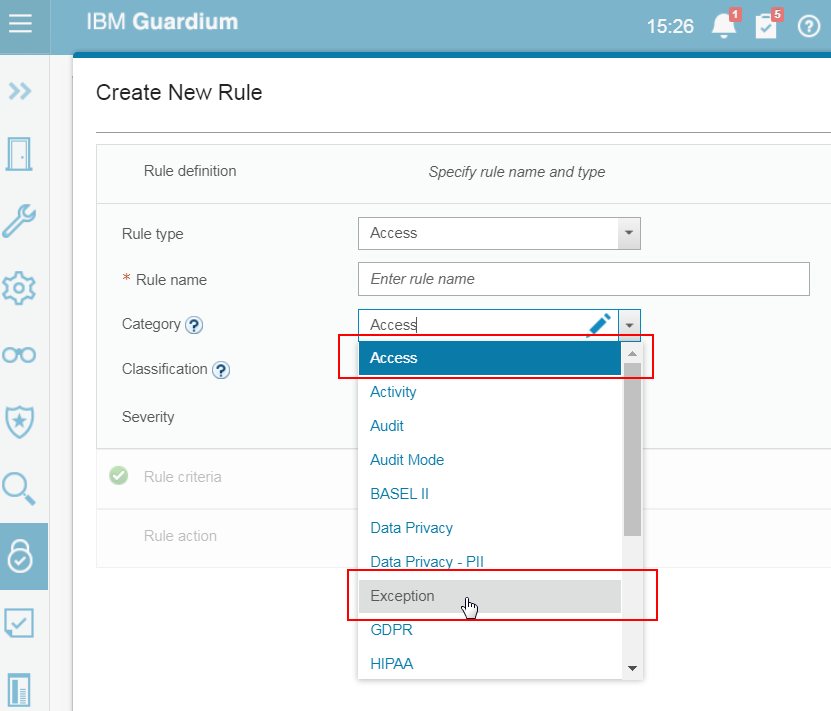
There
are three types of Policy Rules (Figure 5-8) (This is different in Version 11)
· Access rules are applied to the database traffic that comes from client to server (accessing the database).
· Exception rules are applied to database exceptions such as failed logins, SQL errors.
· Extrusion rules are applied to database traffic from the database to client (results sets). The database exceptions are excluded.
· Exception rules are applied to database exceptions such as failed logins, SQL errors.
· Extrusion rules are applied to database traffic from the database to client (results sets). The database exceptions are excluded.
Performance optimization and tuning
This
section discusses the built-in tools available to monitor and analyze the health
of all InfoSphere Guardium components. Being able to leverage these tools is
not only an essential part of ensuring that your Guardium environment is running
smoothly, but can also be used when planning future expansion.
Configuring
and interpreting these built-in tools means little if you do not know what
corrective steps can be taken when issues are identified. Therefore, this section
devotes considerable time discussing the various strategies available to get
things running smoothly.
S-TAP optimization and tuning
Beginning
in Guardium V9, the primary tool for determining the overall health and performance
of S-TAP is the S-TAP Statistics report. The S-TAP Statistics report is based
on information collected from both S-TAP and K-TAP on the host server, and can
be displayed as an interactive report or as part of an audit process. The information
is collected at a configurable interval by the guard stap process.
Creating S-TAP Statistics report
There
are no pre-defined reports for S-TAP statistics. There is, however, a new
S-TAP
statistics domain for the purpose of creating custom reports. The process
of
creating custom reports is not covered in this section. Figure 7-1 shows an
example report to get you started.
Figure 7-1 Sample S-TAP Statistics
report
Interpreting the S-TAP Statistics report
To
properly interpret the S-STAP Statistics report, it first helps to separate the
fields in the report that are cumulative versus the fields that are real-time. Cumulative
means that the values in the fields are not reset until done manually using a
command on the host side - like the odometer in your car. Real-time fields are
dynamic and do not required to be reset - like your vehicle’s speedometer.
Real-time
values
There
two real-time value fields:
System
CPU Percent
The System CPU Percent field will be populated
with the CPU utilization by all
processes on the host database server. It is
useful for showing how busy the
host server is overall.
S-TAP
CPU Percent
The S-TAP CPU Percent field is populated with
the overall CPU utilization of
S-TAP for the entire system. It is calculated
using the pcpu option from the ps
command.
Cumulative
values
The
cumulative value fields include the following:
·
Total Bytes Processed so far
·
Total Buffer Init
·
Buffer Recycled
·
Total Bytes Dropped so Far
·
Total Bytes Ignored
·
Total Response Bytes Ignored
Possible Performance Issues
Performance Issue 1: Analyzer queue overflow
Figure
7-8 depicts a scenario where a sudden increase in the analyzer rate at 8:43AM
begins to overwhelm the sniffer. Note that even before this increase, the
Analyzer/Parser appeared to be buffering some data, indicating that this
appliance was already operating near its maximum performance.
During
this spike in traffic, the Analyzer must start buffering large amounts of data,
as shown by the increasing values in the Analyzer Queue Length. At approximately
8:48AM, the Analyzer/Parser buffers are full, and the sniffer begins to drop
data as shown in the Analyzer Lost Packets column. This kind of performance
issue does not appear to be an isolated incident on this machine, as indicated
by the large number of lost packets, which existed prior to this event.
Figure 7-8 Analyzer queue
overflow
There
are a variety of reasons for issues with the Analyzer Queue overflowing, but
the most common reason is that the sniffer cannot cope with the high rate of traffic
being monitored. In these cases, you must reduce the amount of traffic being
monitored by the appliance using one of these strategies:
Moving
some of the S-TAPs to less busy appliances.
·
Introducing rules to filter additional
traffic. The most effective rule action to achieve filtering is the IGNORE STAP
SESSION rule, because the sessions are ignored by the S-TAP itself instead of
being sent across the network to the appliance.
·
S-TAP load balancing. Sometimes, a very busy
database server can overwhelm a collector all by itself. In these cases, it
might help to load balance the traffic from this database to two or more
collectors.
·
Consider using a Selective Audit policy. By
default, the collector logs all data sent to it from S-TAPs or Hardware TAPs. A
Selective Audit policy changes this behavior by only monitoring the
database traffic specified in the policy rules.
Performance Issue 2: Logger queue overflow
Figure
7-9 shows a sudden increase in the logger queue. The analyzer queue is also
high but recovers after two minutes. The logger queue is different than the analyzer
queue in that it is not circular and will continue to allocate memory until the
sniffer reaches the 2.5GB limit. In this report, observe that as the logger queue
starts to grow at 8PM, the memory consumed by the sniffer (shown in the memory
column) begins to increase by a proportional amount. When the sniffer reaches
the 2.5GB limit, it restarts.
Note
that after the sniffer allocates memory, it does not release it even if the logger
queue recovers. Therefore, it is possible to have a high sniffer memory utilization
even if the logger queues are not holding any data.
Figure 7-9 Logger queue overflow
Sniffer
restarts due to logger queue overflow is also shown in the collector’s syslog
file (/var/log/messages). These messages come in two varieties. The first is a
sniffer Memory Allocation Problem, which happens when the logger queues grow
very quickly (see Figure 7-10).
Figure 7-10 Sniffer memory allocation problem.
The
second type of restart due to logger queue overflow happens when the Guardium
“nanny” process, which monitors sniffer memory utilization, detects that the
sniffer is dangerously close to the 2.5GB limit and restarts it (see Figure
7-11). Usually, both types of restarts are caused by the same issues, the only
difference being the speed at which the sniffer memory grows. Memory allocation
problems happen when the sniffer memory grows very quickly, before the nanny
process can react.
Figure 7-11 Nanny process killing the sniffer.
There are a few different reasons that can
cause the logger queue to grow:
·
Too much traffic or an overly aggressive
policy with many heavy rules such as Log Full Details. Though the solutions for
Analyzer Queue issues can also apply here, most times it may be sufficient to
reduce the number of Log Full Details or policy violation rules in the policy,
or make such rules less inclusive.
·
Another possibility is that the logger may be
competing for MySQL resources if there are an excessive number of reports,
correlation alerts, or other internal processes running in the background. If
your environment includes an Aggregator, consider running daily reports on that
appliance instead.
Install Guardium VM Collector Image
Installation on Virtual Appliances
While
IBM InfoSphere Guardium can be installed on any VMware product, the VMware ESX
server is the recommended platform for a virtual solution.
Notes:
1. Hardware requirements for the virtual
solution are restricted to the platforms supported by VMware.
2. When using the virtual solution,
Database Activity Monitoring must be done via S-TAP agents.
3.
Due to VMware’s performance limitations, it is not
recommended to use the virtual solution when monitoring high volumes of
database activity. The virtual solution is recommended for smaller environments
and for the “Privileged Users Monitoring” audit mode.
Preparations
Preparing
for the deployment of the appliance, the network administrator needs to supply:
·
IP address for the interface card (eth0), and
optionally an IP address for a secondary management interface connection.
·
Default router IP address.
·
DNS server IP addresses (up to three
addresses), and add the new appliance to the DNS server.
·
Hostname and domain name to assign to system
·
Subnet mask for primary IP address
·
(Optional) NTP server hostname.
·
(Optional) SMTP configuration information (for
email alerts): IP address, port, and if authentication is used, an SMTP user
name and password.
·
(Optional) SNMP configuration information (for
SNMP alerts) the IP address of the SNMP server and the trap community name to
use.
Virtual
Appliance
The
IBM InfoSphere Guardium Virtual Machine (VM) is a software-only solution
licensed and installed on a guest virtual machine such as VMware ESX Server.
To
install the IBM InfoSphere Guardium VM, follow the steps in Appendix B – How to
Create the Virtual Image. A summary of the steps in the appendix is:
·
Verify system compatibility
·
Install VMware ESX Server
·
Connect network cables
·
Configure the VM Management Portal
·
Create a new Virtual Machine
·
Install the IBM InfoSphere Guardium virtual appliance
After
installing the VM, return to Step 4, Setup Initial and Basic
Configurations on page 6 for further instructions on how to configure the
IBM InfoSphere Guardium system.
Setup Initial & Basic Configuration
The
initial step should be the network configuration and must be done locally
through the Command Line Interface (CLI) accessible through the serial port or
the system console.
Enter
the temporary cli password you supplied previously.
In
the following steps, you will supply various network parameters to integrate
the IBM InfoSphere Guardium into your environment, using cli commands.
In
the cli syntax, variables are indicated by angled brackets, for example:
<ip_address>
Replace
each variable with the appropriate value for your network and installation (but
do not include any brackets).
Note:
Do not change the hostname and the time zone in the same CLI session.
Set the primary System IP Address
The
primary IP address is for the ETH0 connection, and is defined using the
following two commands:
·
Store network interface ip <ip_address>
·
Store network interface mask
<subnet_mask>
Optionally,
a secondary IP address can be assigned, but this can only be done from the GUI
after the initial configuration has been performed. The remaining network
interface cards on the appliance may be used to monitor database traffic, and
do not have an assigned IP address.
Set the Default Router IP Address
Store
network routes def <default_router_ip>
Set DNS
Server IP Addresses
Set
the IP address of one or more DNS servers to be used by the appliance to
resolve host names and IP addresses. The first resolver is required, the others
are optional.
·
Store network resolver 1 <resolver_1_ip>
·
Store network resolver 2 <resolver_2_ip>
·
Store
network resolver 3 <resolver_3_ip>
SMTP Server
An
SMTP server is required to send system alerts. Enter the following commands to
set your SMTP server IP address, set a return address for messages, and enable
SMTP alerts on startup.
·
Store alerter smtp relay <smtp_server_ip>
·
Store alerter smtp returnaddr
<[email protected]>
·
Store alerter state startup on
Note:
Configuring the SMTP server can also be done via the Guardium GUI (Admin
console > Configuration > Alerter)
Set Host and Domain Names
Configure
the hostname and domain name of the appliance. This name should match the
hostname registered for the appliance in the DNS server.
·
Store system hostname <host_name>
·
Store system domain <domain_name>
Note:
During basic configuration of the appliance, do NOT change the hostname and the
time zone in the same CLI session. Change hostname, reboot, login and then
change the time zone.
Set the
Time Zone, Date, and Time
There
are two options for setting the date and time for the appliance. Do one of the
following:
Date/Time
Option 1: Network Time Protocol
Provide
the details of an accessible NTP server and enable its use.
·
store system ntp server <ntpserver_name>
·
store system ntp state on
Date/Time
Option 2: Set the time zone, date and time
Use
the following command to display a list of valid time zones:
·
store system clock time zone list
Choose
the appropriate time zone from the list and use the same command to set it
·
store system clock time zone <selected time
zone>
Store
the date and time, in the format: YYYY-mm-dd hh:mm:ss
·
store system clock datetime <date_time>
Note:
Do not change the hostname and the time zone in the same CLI session.
Set the
Initial Unit Type
An
appliance can be a standalone unit, a manager or a managed unit; In addition,
an appliance can be set to capture database activity via network inspection or
STAP or both. The standard configuration would be for a standalone appliance
(for all appliances), and the most common setting would use STAP capturing
(only for collectors).
·
store unit type standalone all appliances
·
store unit type stap for collectors
Unit
type standalone and unit type stap are set by default. Unit type manager (if
needed) must be specified.
Note:
Unit type settings can be done at a later stage, when the appliance is fully
operational.
Reset Root Password
Reset
your root password on the appliance using your own private passkey by executing
the following CLI command (requires access key: „t0Tach‟):
·
support reset-password root <N>|random
Save
the passkey used in your documentation to allow future Technical Support root
accessibility. To see the current pass key use the following CLI command:
·
support show passkey root
Validate All Settings
Before
logging out of CLI and progressing to the next configuration step, it is recommended
to validate the configured settings using the following commands:
·
show network interface all
·
show network routes defaultroute
·
show network resolver all
·
show system hostname
·
show system domain
·
show system clock time zone
·
show system clock datetime
·
show system ntp all
·
show
unit type
Reboot the System
Reboot
the system to complete the basic configuration. If the system is not in its
final location, now is a good time to shut the system down, place it in its
final network location, and start it up again. Remove the installation DVD
before rebooting the system.
To
reboot the system, enter the following command in CLI:
·
restart system
The
system will shut down and reboot immediately after the command is entered. Upon
startup, the system should be accessible (via CLI and GUI) through the network,
using the provided IP address and hostname.
Step 5. What to do next
This
section details the steps of verifying the installation by logging on to the
appliance; setting unit type, installing license keys, and other installations
– patches, S-TAPs, Inspection Engines, CAS.
Verify Successful installation
1. Login to CLI - ssh cli@<ip of
appliance>
2.
Login to GUI - https://<ip of appliance>:8443
Login
to the IBM InfoSphere Guardium web-based interface and go to the embedded
online help for more information on any of the following tasks.
Set
Unit Type
To
set up a federated environment, configure one of the appliances as the Central
Manager and all the other appliances should be set to be managed by the
management unit. See “store unit type” command in the Appendices help book,
under the CLI topic
Install
License Keys
See
System Configuration in the Guardium Administration help book. (Note: in
federated environments, license keys are installed only on the Central Manager)
Specific
product keys, which are based on the customer’s entitlements, must be installed
through CLI or the GUI as described below.
From
the GUI:
1.
Log in as “admin” to the IBM InfoSphere Guardium console.
2.
Navigate to Administration Console -> Configuration -> System
3.
Enter the License Key(s) in the System Configuration panel
From the CLI:
1. Log in to the CLI
2. Issue the store
license console CLI command to store a new license.
Store license console
3. Copy and paste the new
license at the cursor location. Make sure to type an equal sign (=) at end of
license code. Press Enter and then CTRL-D.
Install maintenance patches (if available)
Patches can be installed
through CLI (see “store system patch” command) or through the GUI. See the Central
Patch Management topic in Aggregation and Central Management help
book. (Note: in federated environments, maintenance patches can be applied to
all of the appliances from the Central Manager)
There may not be any
maintenance patches included with the installation materials. If any are
included, apply them as described below.
1. Log in to the IBM InfoSphere Guardium console, as the cli user,
using the temporary cli password you defined in the previous
installation procedure. You can do this by using an ssh client.
2. Do one of the following:
·
If installing from a patch CD, Insert the CD into the IBM
InfoSphere Guardium CD drive, enter the following command, and skip ahead to
step 3:
o
store system patch install cd
·
If installing from a network location, enter the following
command (selecting either ftp or scp):
o
store system patch install [ftp | scp]
Respond to the following
prompts (be sure to supply the full path name to the patch file):
o
Host to import patch from: User on <hostname>: Full path to
patch, including name: Password:
If installing using the
fileserver function, enter the following command:
o
store system patch install sys
3. You will be prompted to
select the patch to apply:
Please choose one patch to
apply (1-n,q to quit):
o
Type the number of the patch to apply, and then press Enter.
4. To install additional
patches, repeat steps 2 and 3.
Install S-TAP agents
Install
S-TAP agents on the database servers and define their inspection engines
S-TAP
is a lightweight software agent installed on the database server, monitors
local and network database traffic and sends the relevant information to the
IBM InfoSphere Guardium appliance (the collector) for further analysis,
reporting an alerting.
To
install an S-TAP, refer to the “S-TAP help book” included in the product
manuals
To
verify that the S-TAPs have been installed and are connected to the IBM
InfoSphere Guardium appliance:
1.
Log in to the IBM InfoSphere Guardium administrator portal.
2.
Do one of the following:
Navigate
to the Tap Monitor ->S-TAP tab, and select S-TAP Status from
the menu. All active S-TAPs should display with a green background. A red
background indicates that the S-TAP is not active.
Navigate
to Administration Console ->Local Taps ->S-TAP Control, and
confirm that there’s a green status light for this S-TAP
Define Inspection Engines
Define
Inspection Engines for network-based activity monitoring.
Install CAS agents
Install
Configuration Auditing System (CAS) agents on the database server.
More Information
For
more information, go to the following online resources:
o
IBM InfoSphere Guardium home page:
http://www.ibm.com/software/data/info/guardium/
o
Technical Support home page: http://www.ibm.com/software/support/


![[5 Mins Docker] Deploy FreshRSS Using Docker Run Command and Deploy To Fly.io](https://lh3.googleusercontent.com/blogger_img_proxy/AEn0k_vQADXkyVY-9pDEd-OoIgmLJz5AGDpKSNmKffQdM9J0tr5e4iyBaYtGi2YNQWJJeKbWvs3eDaBGEXVmVTYKrqEBLfiT3rXBv-OAYTlmcJaoXA)


No comments:
Post a Comment