This post is to record some key points to set up a Microsoft Sentinel Lab
Steps to build a basic Sentinel Environment
1. SetupData Sources in LAB
- Virtual Network (VNet)
- Network Security Group (NSG)
- Virtual Machines (2 windows with 1 MS SQL DB, 1 linux)
- Log Analytics Workspace
- Azure Key Vault
- Azure Storage Account
- Microsoft Sentinel
Always Free Data Sources & Data Types:
Not Free but recommended:
- Microsoft Entra ID
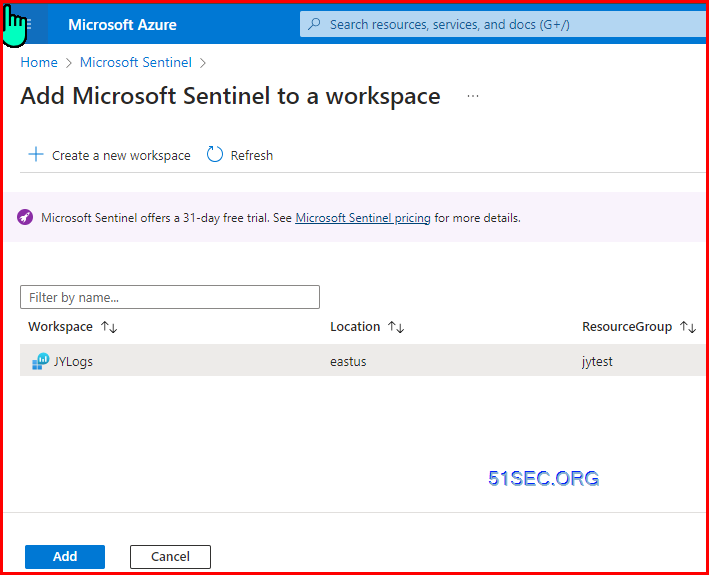
Create Log Analytics Workspace and Sentinel
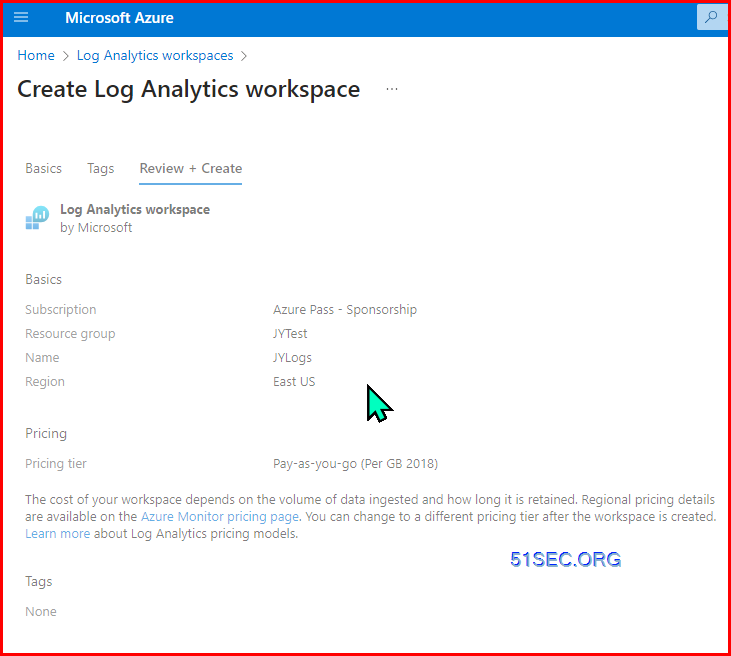
Create Sentinel
Add watchlist in, which is used to generate geography map based on IP
https://github.com/kphillip1/azure-soc-honeynet/blob/main/geoip-summarized.csv
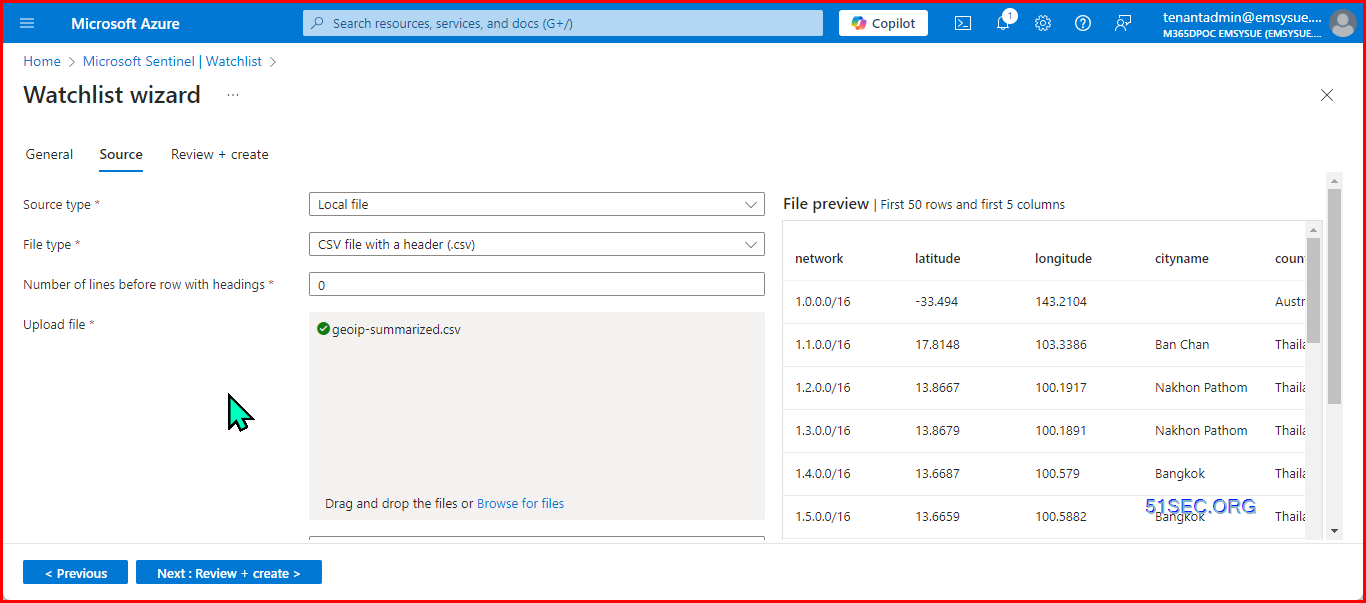
Searchkey = network
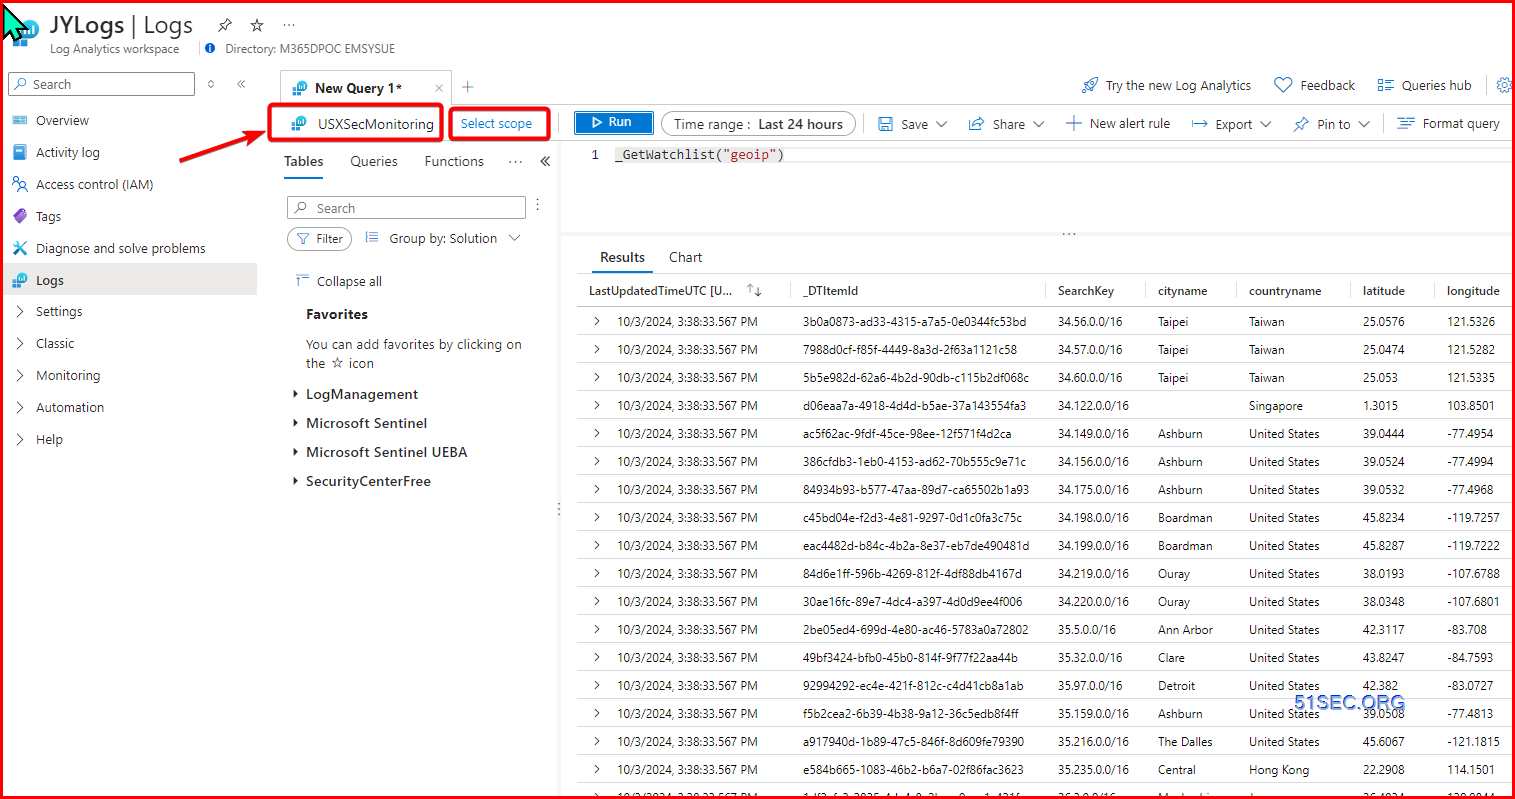
Verify it from Log analytics workspace:
- _GetWatchlist("geoip")
- _GetWatchlist("geoip") | count
make sure scope is the one you add the watchlist.
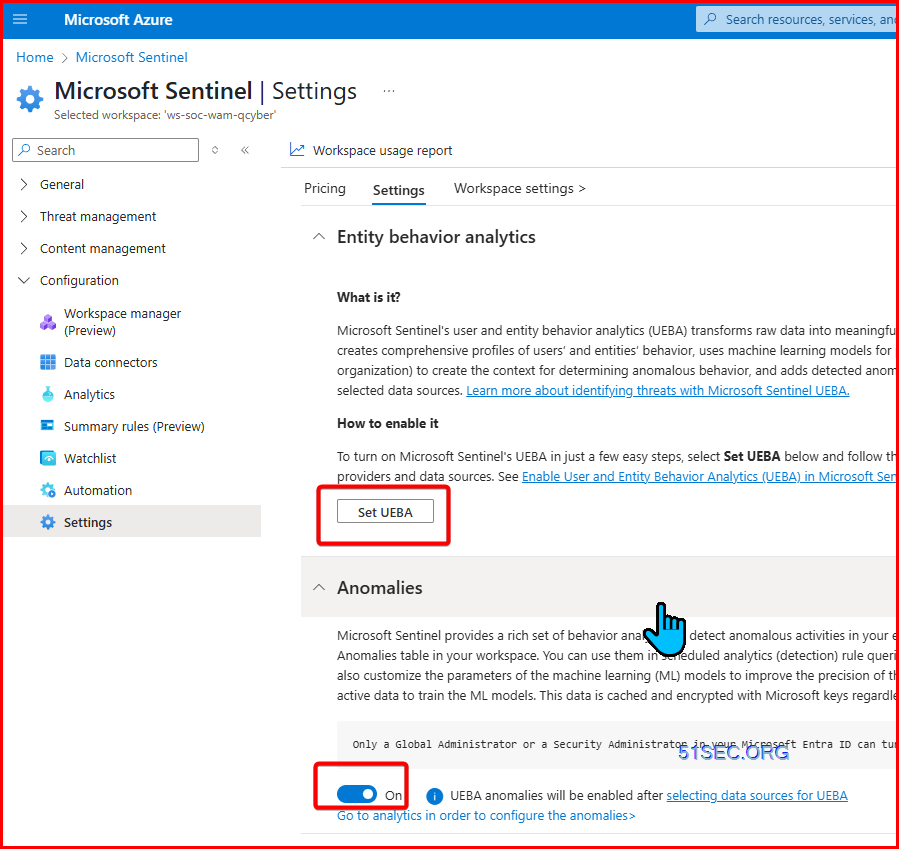
Enable UEBA
- Entity behavior analytics
- Anomalies
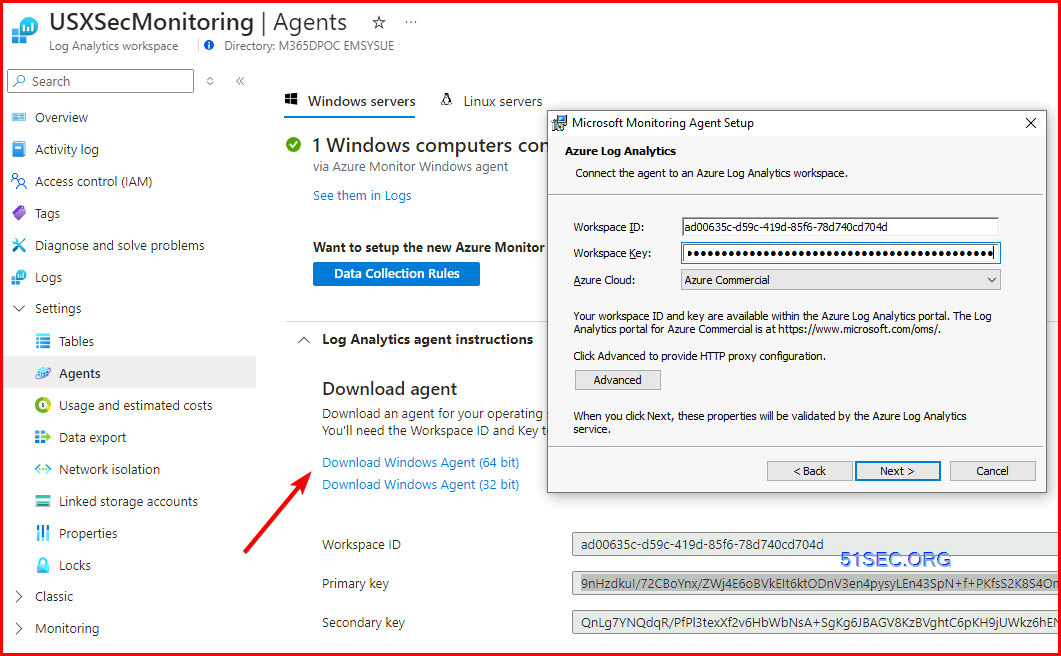
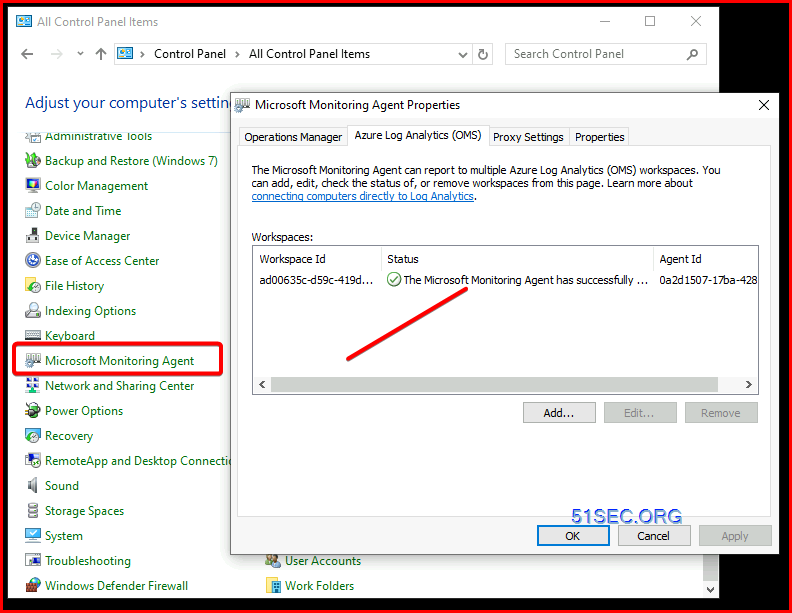
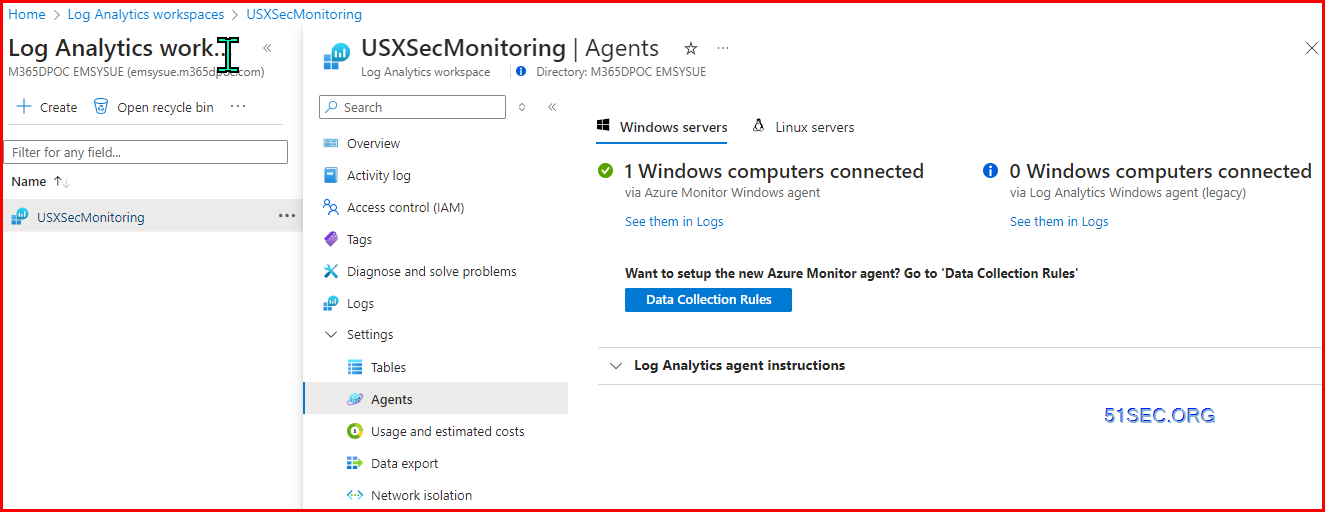
Install Microsoft Monitoring Agent for Log Analytics Workspace
Legacy way:
New Way:
Using DCR rule to install AMA extension on ARC enabled machines.
Azure Arc script is to be used on the machine outside of Azure environment.
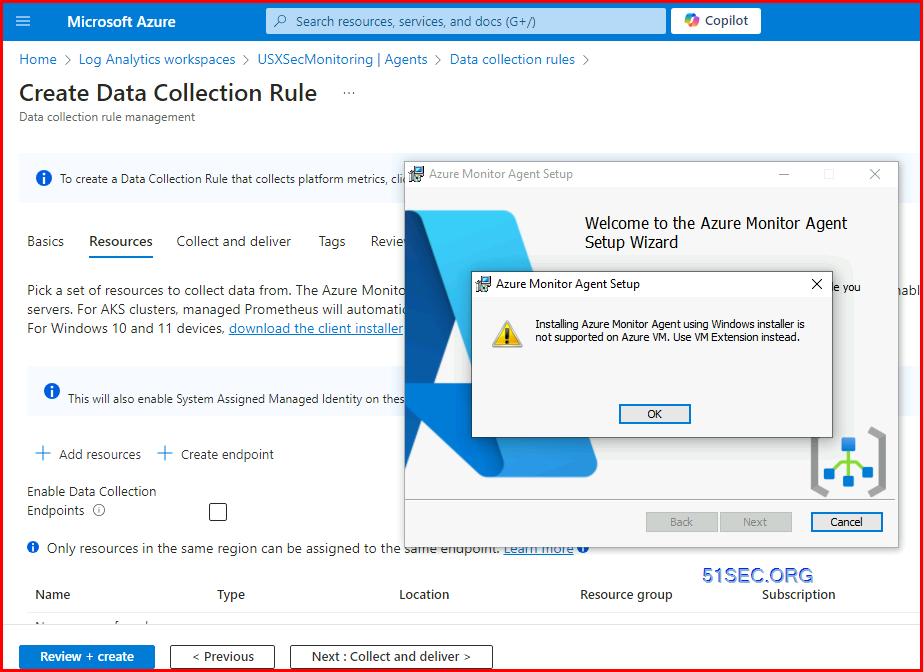
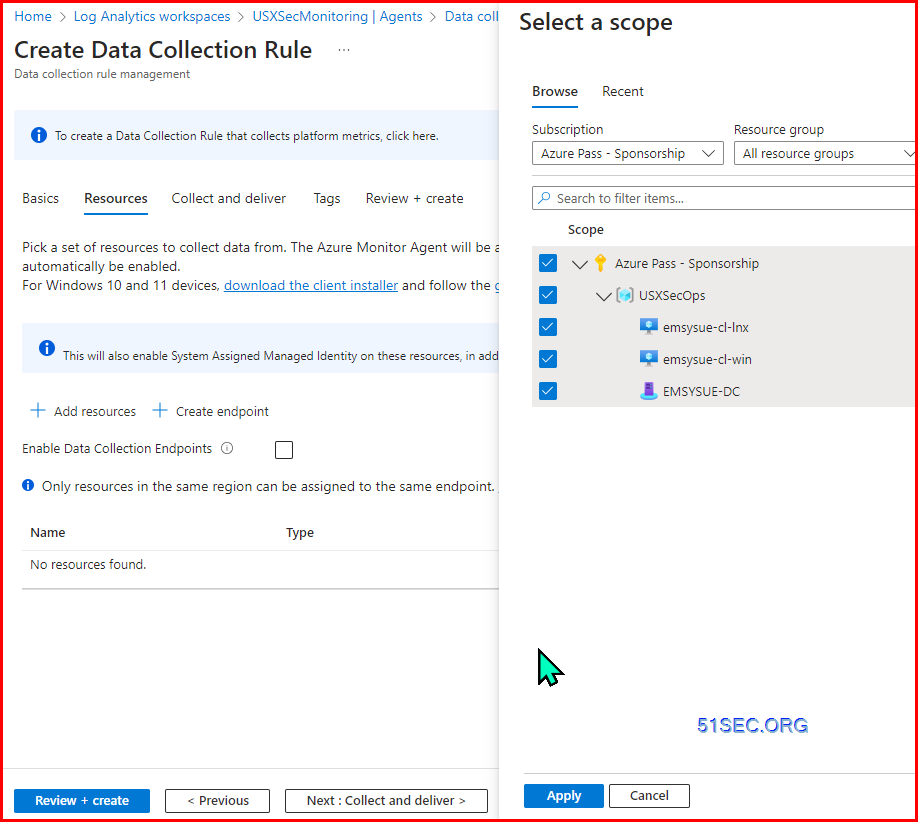
If you directly download the client to install from Data Collection Rule's Resources page:
You will get an alert to say using Windows installer is not supported on Azure VM. Use VM Extension instead.
2. For Azure VM, just need to enable Logs for Virtual Machine Monitoring
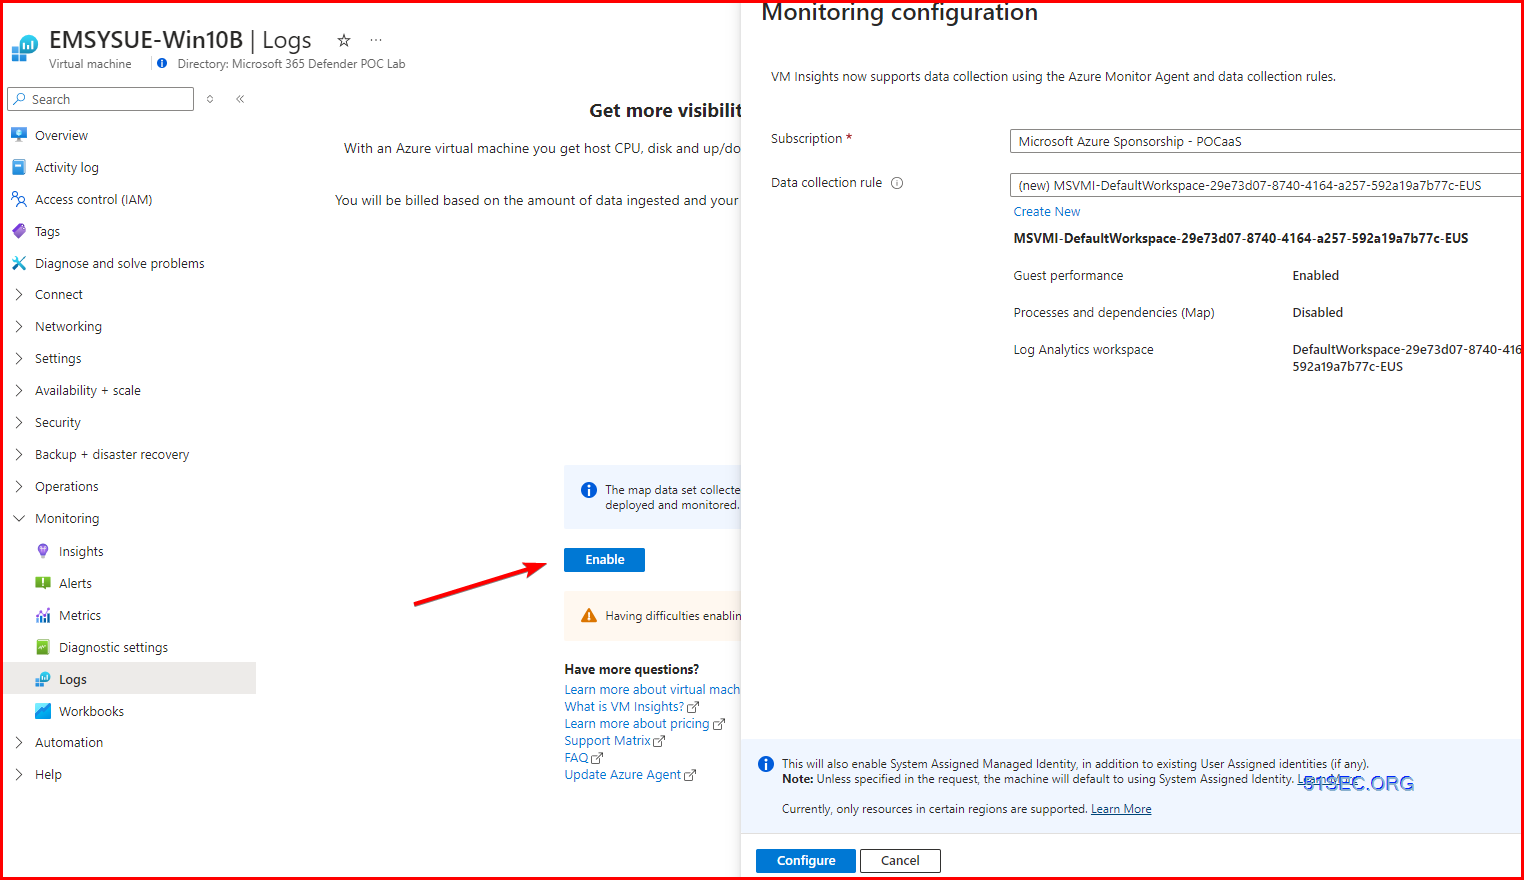
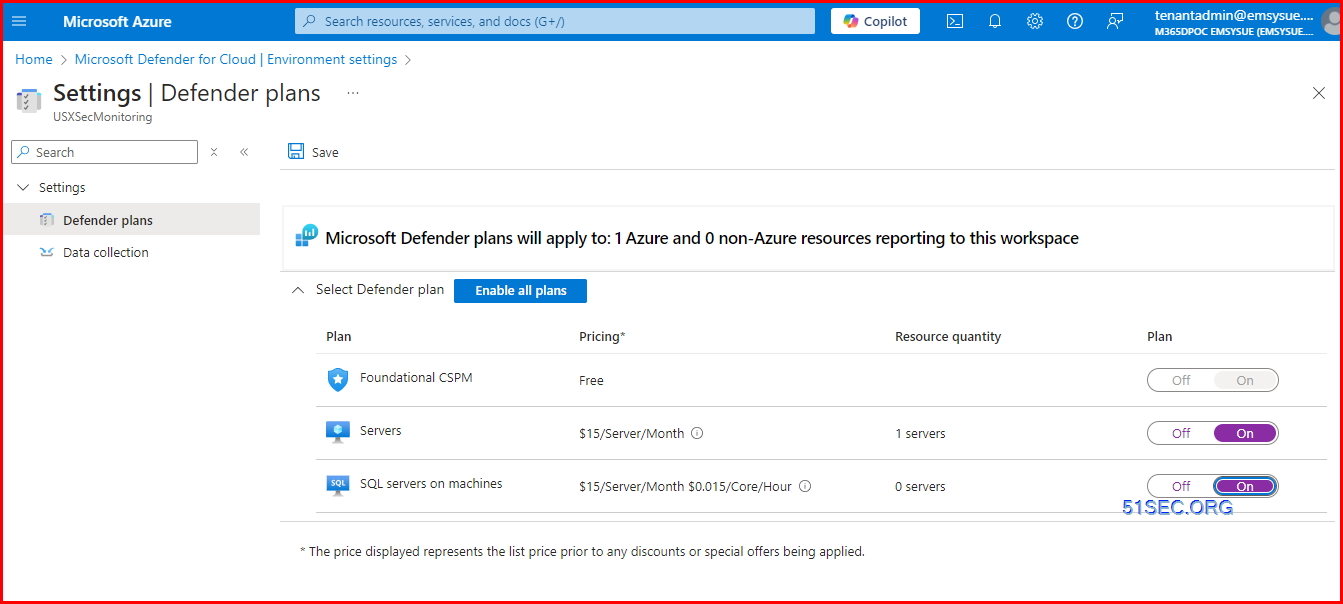
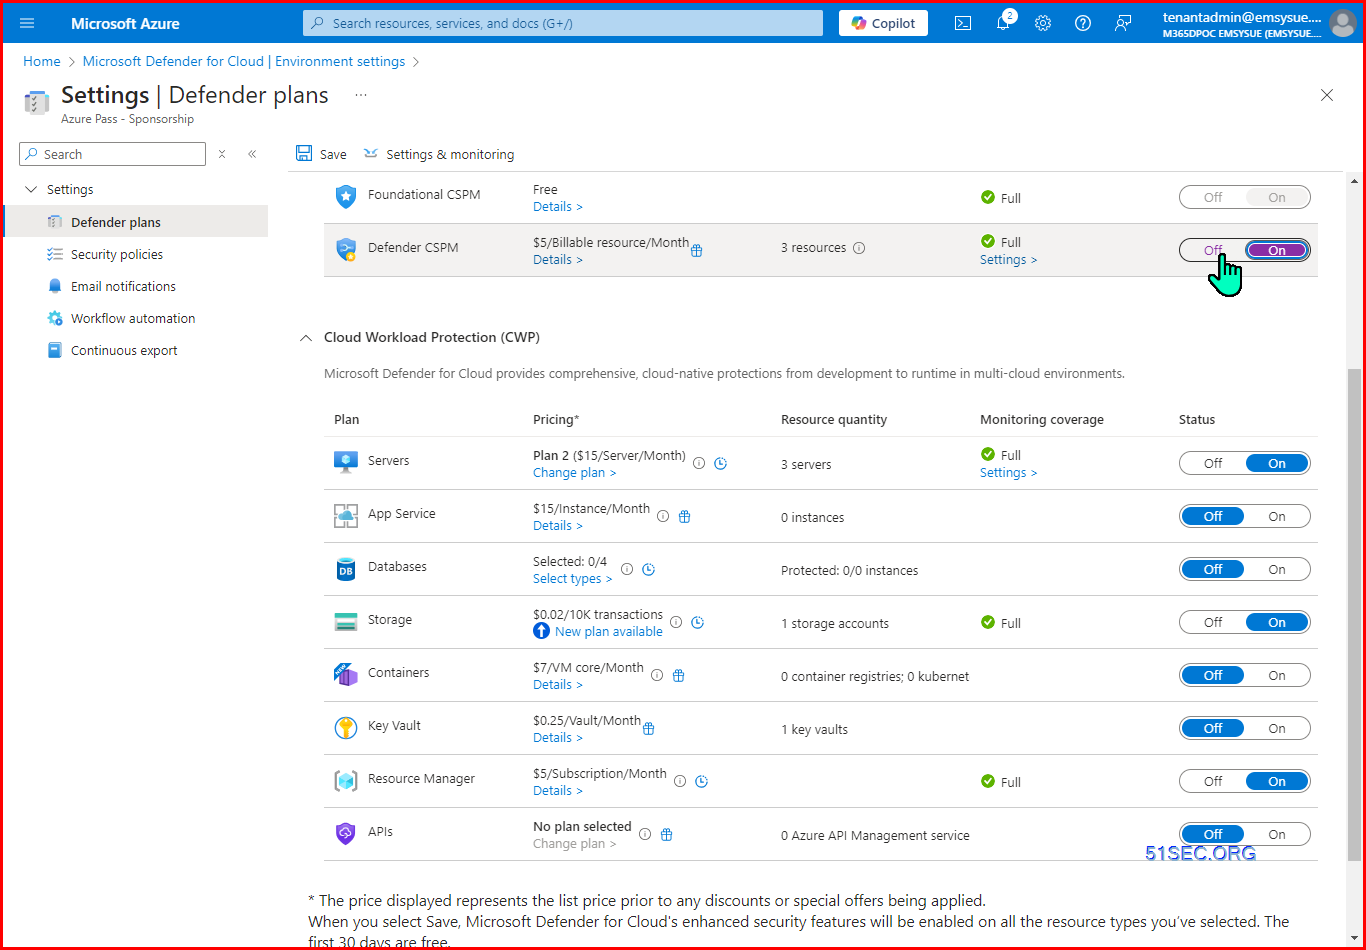
Microsoft Defender for Cloud
Choose the subscription -> Analytics Workspace -> JYLogs
Create Data Collection Rules:
For all events.
@subscription level,
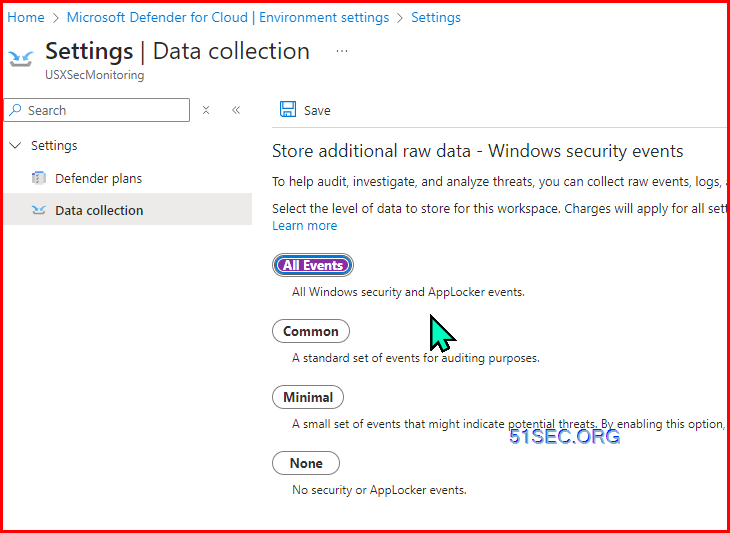
Click on settings in previous screenshot:
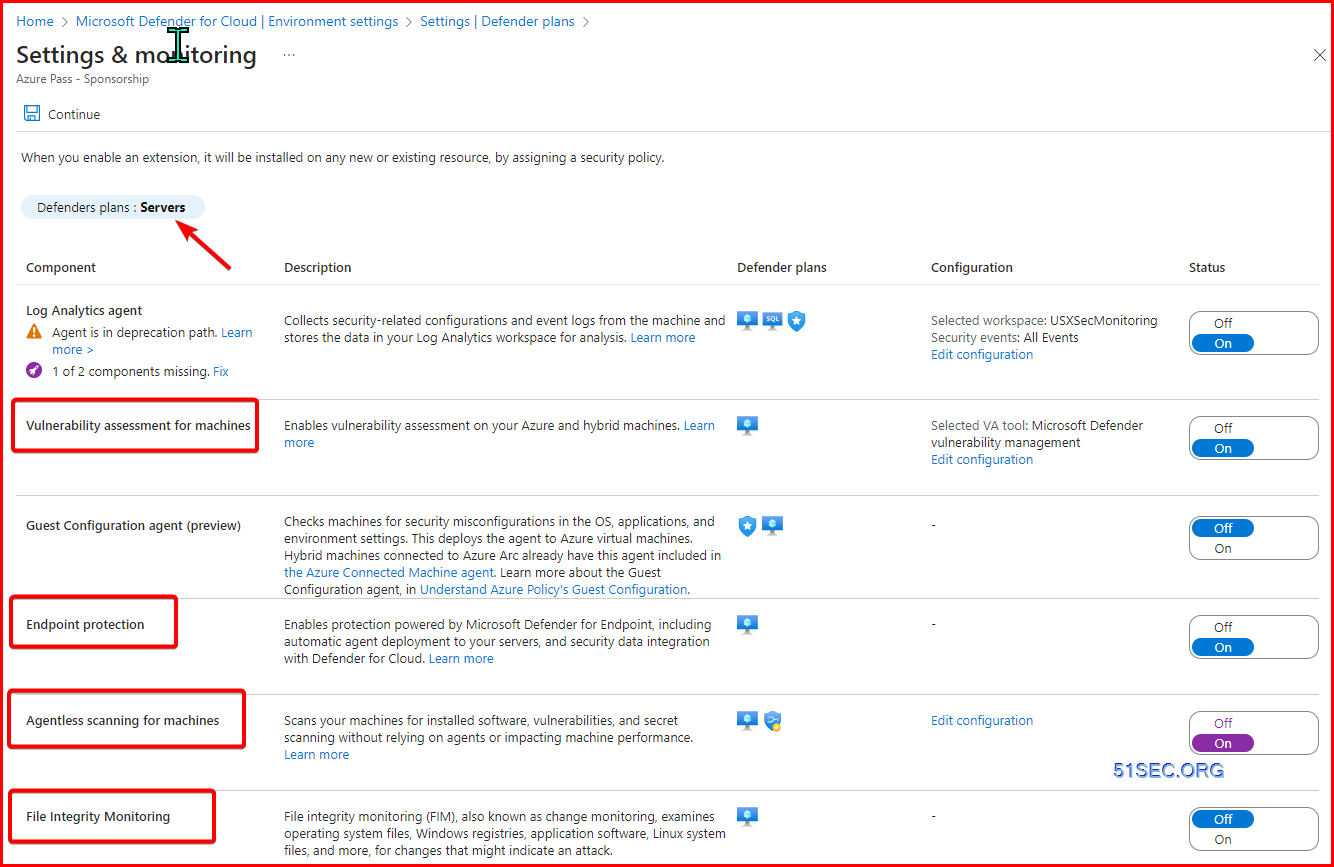
You also can edit configuraiton from previous screenshot to configure Auto-provisioning configuraiton
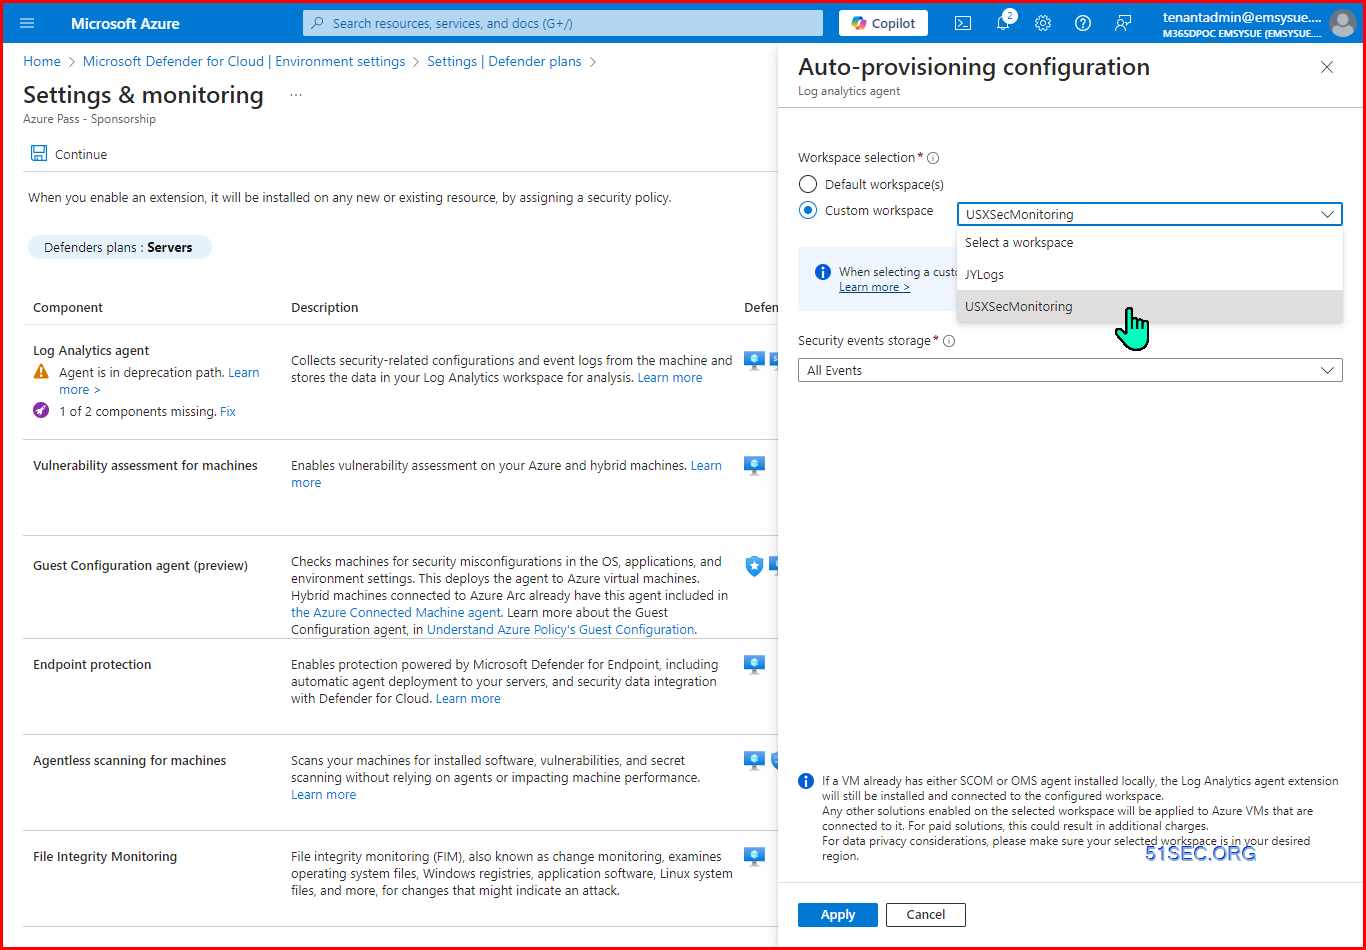
@subscription level
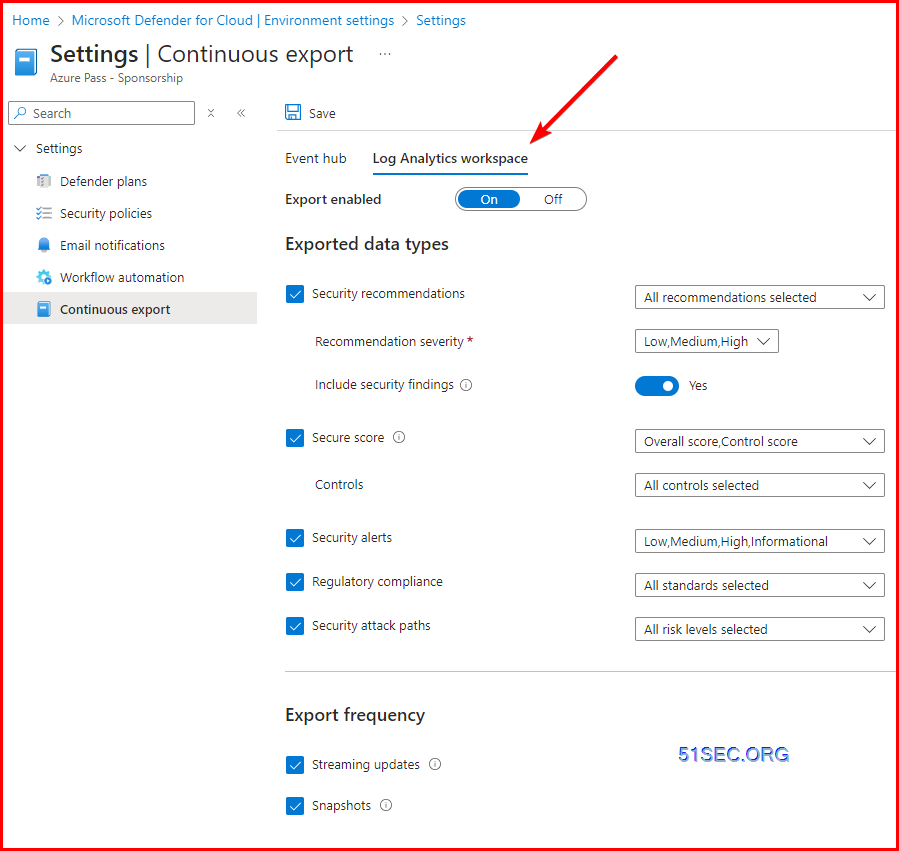
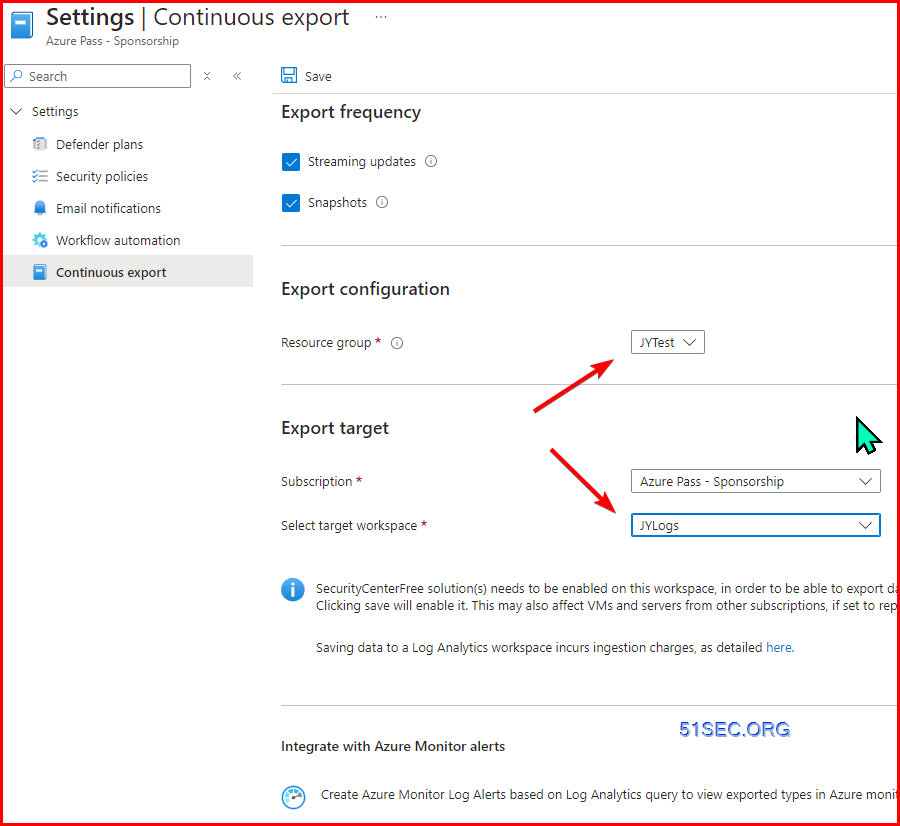
Enable continuous export to Log Analytics workspace
Onboard Entra ID Logs
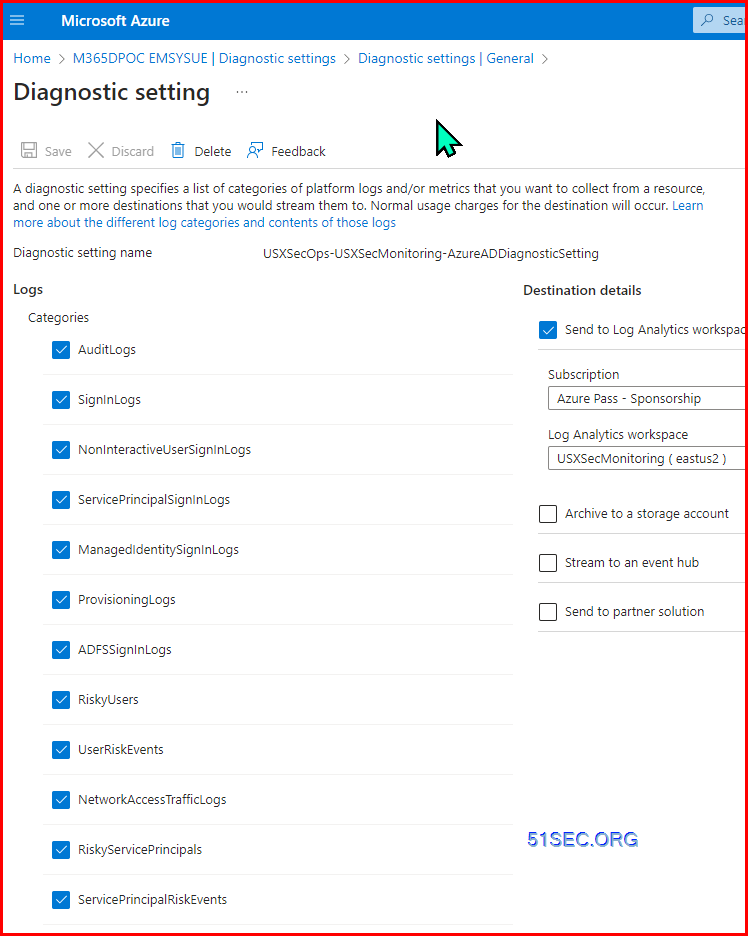
- AuditLogs
- SigninLogs
Onboard Monitor Logs
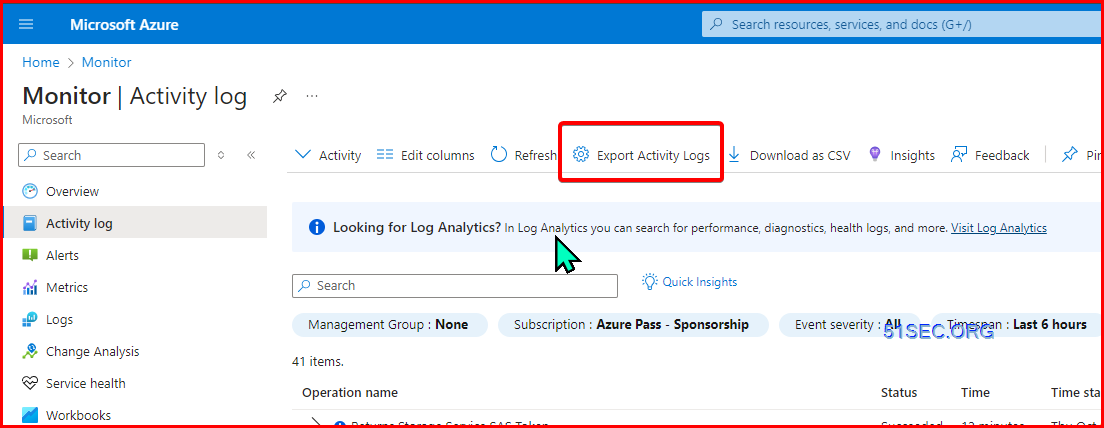
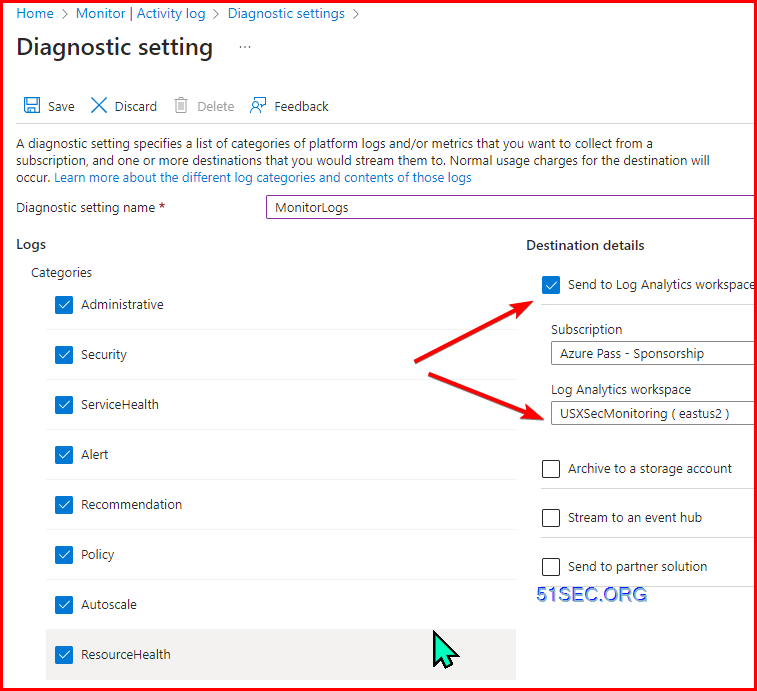
Checking table: AzureActivity
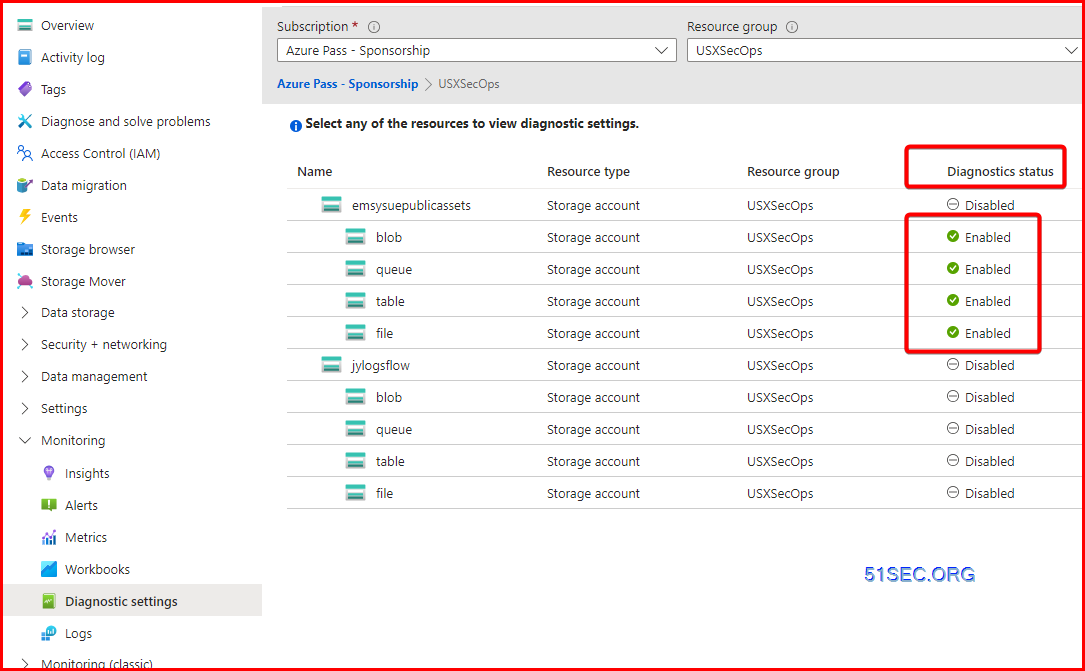
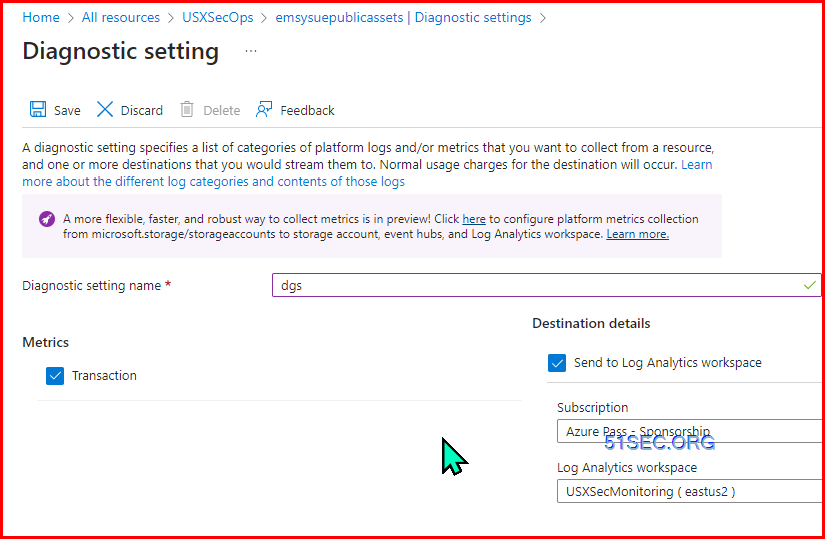
Stoage Accounts
Onboard NSG Logs
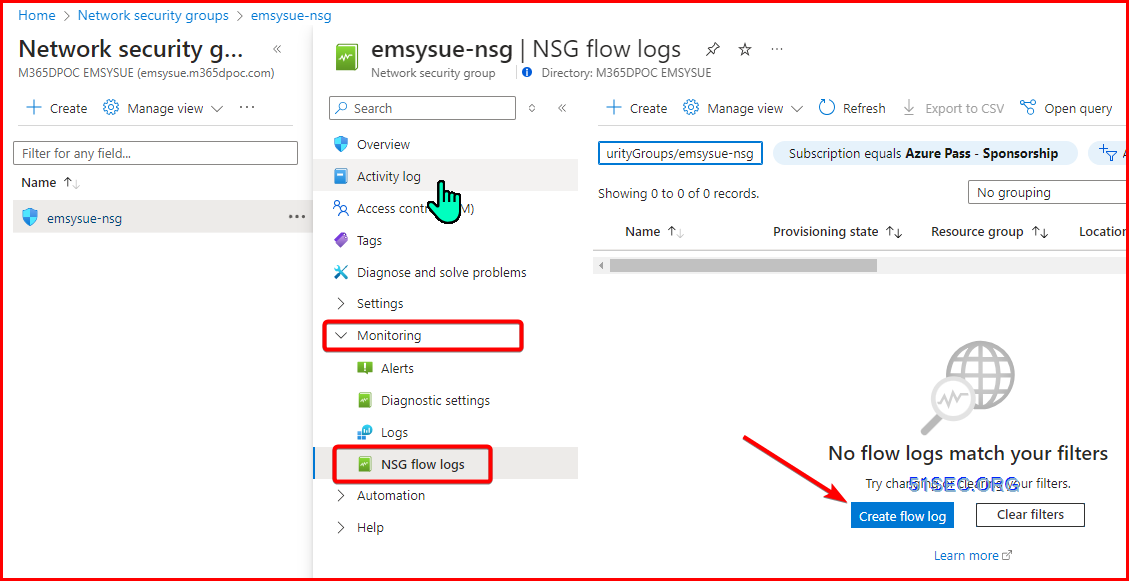
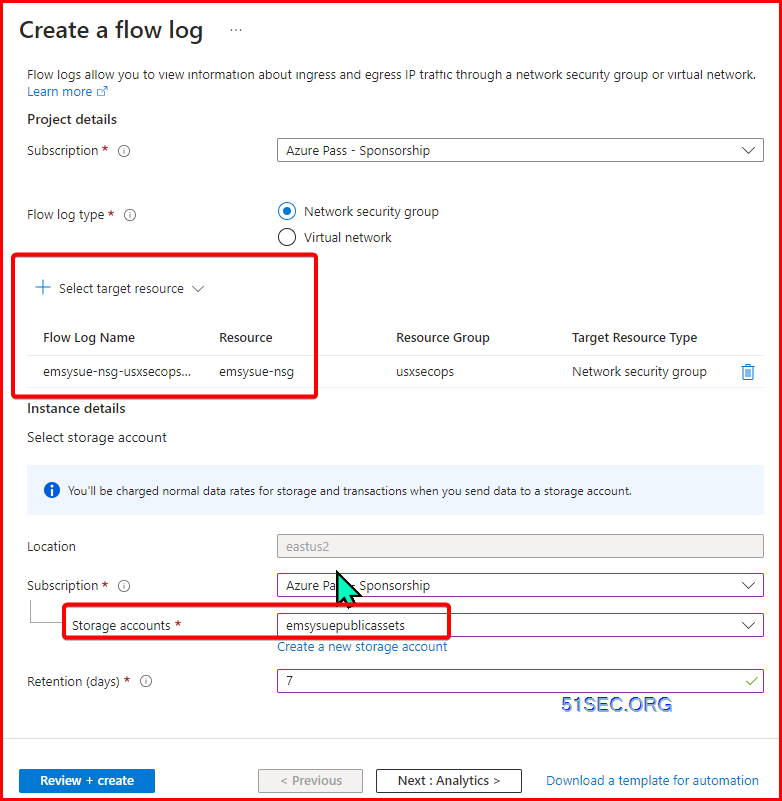
Create a flow log
select target resource and storage account
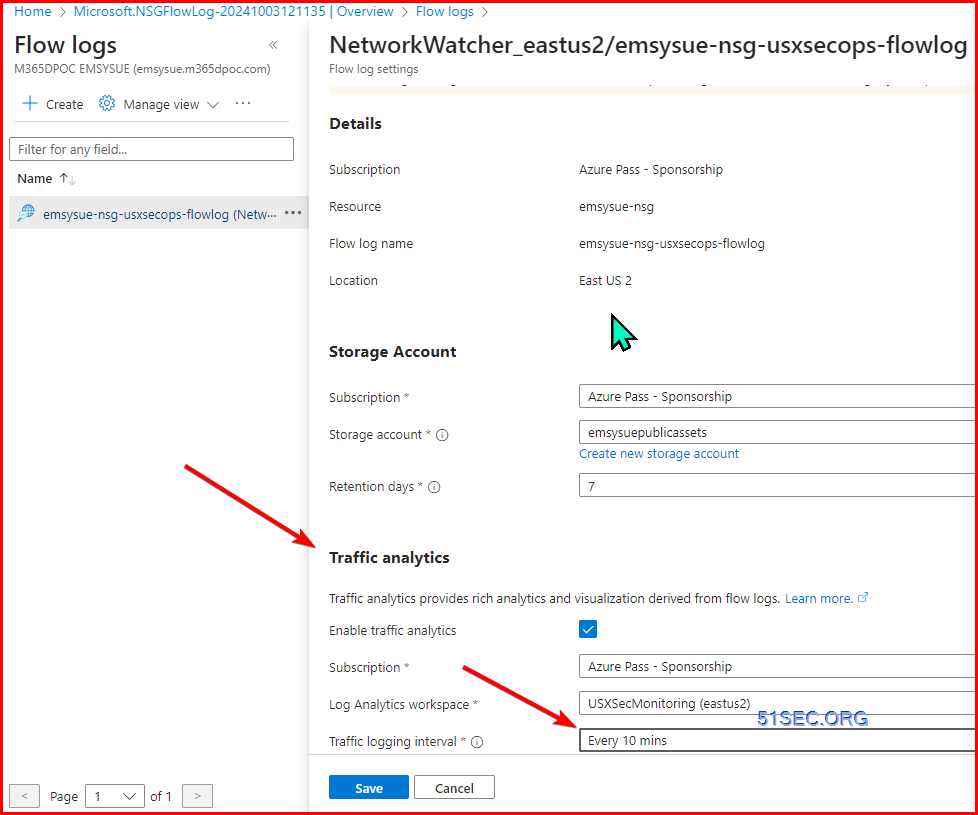
Enable Traffic Analytics
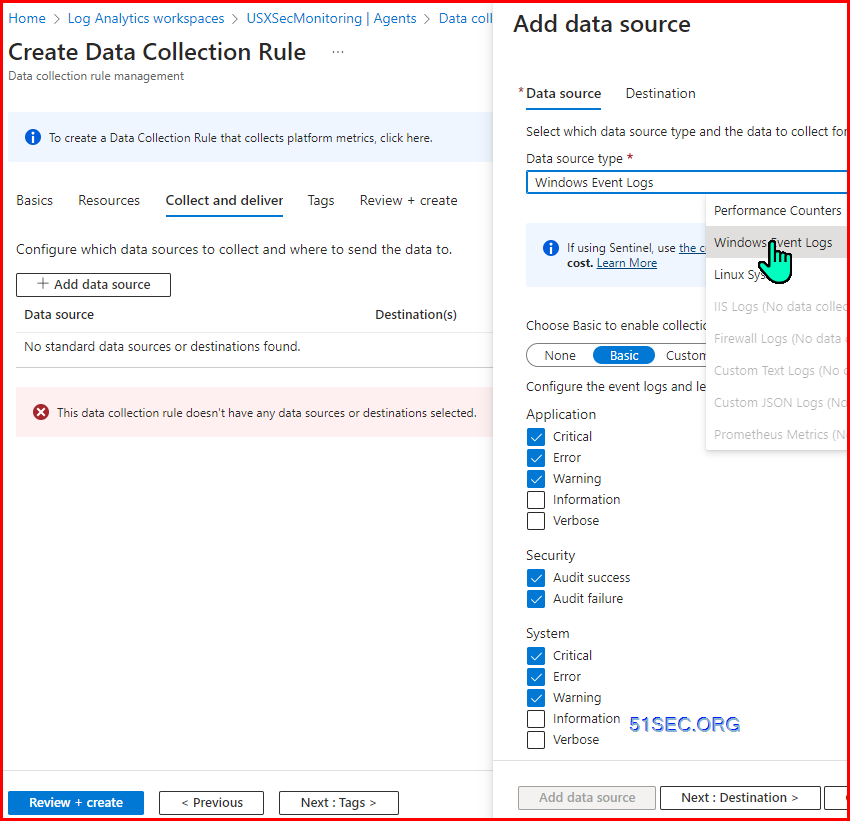
Create Data Collection Rules for Windows & Llnux Servers
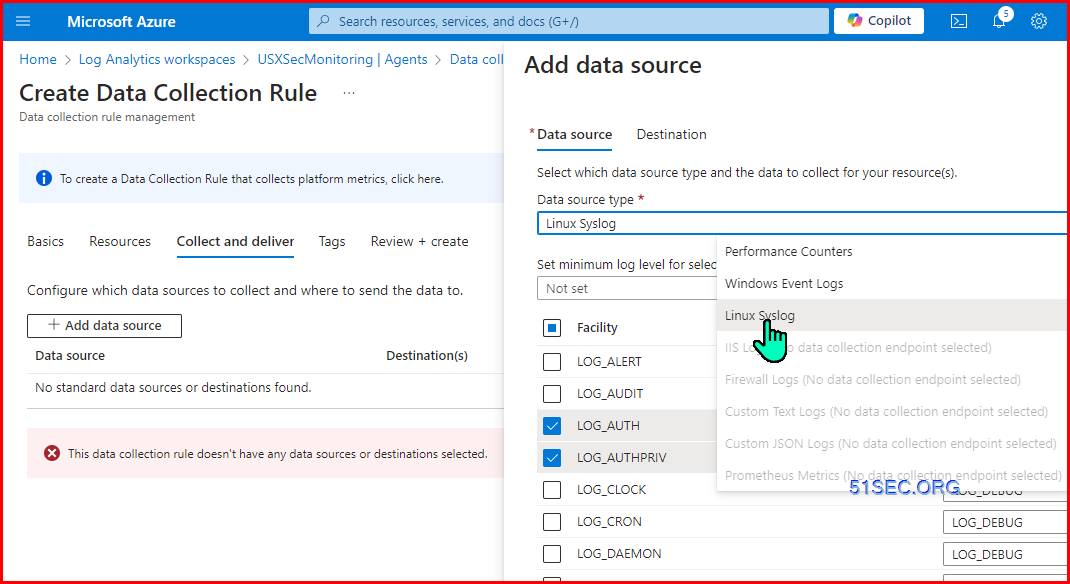
You might want to create an azure monitor workspace first
then you can send all Windows logs and Linux Logs to Azure Monitor Workspace
Add custom XPath queries:
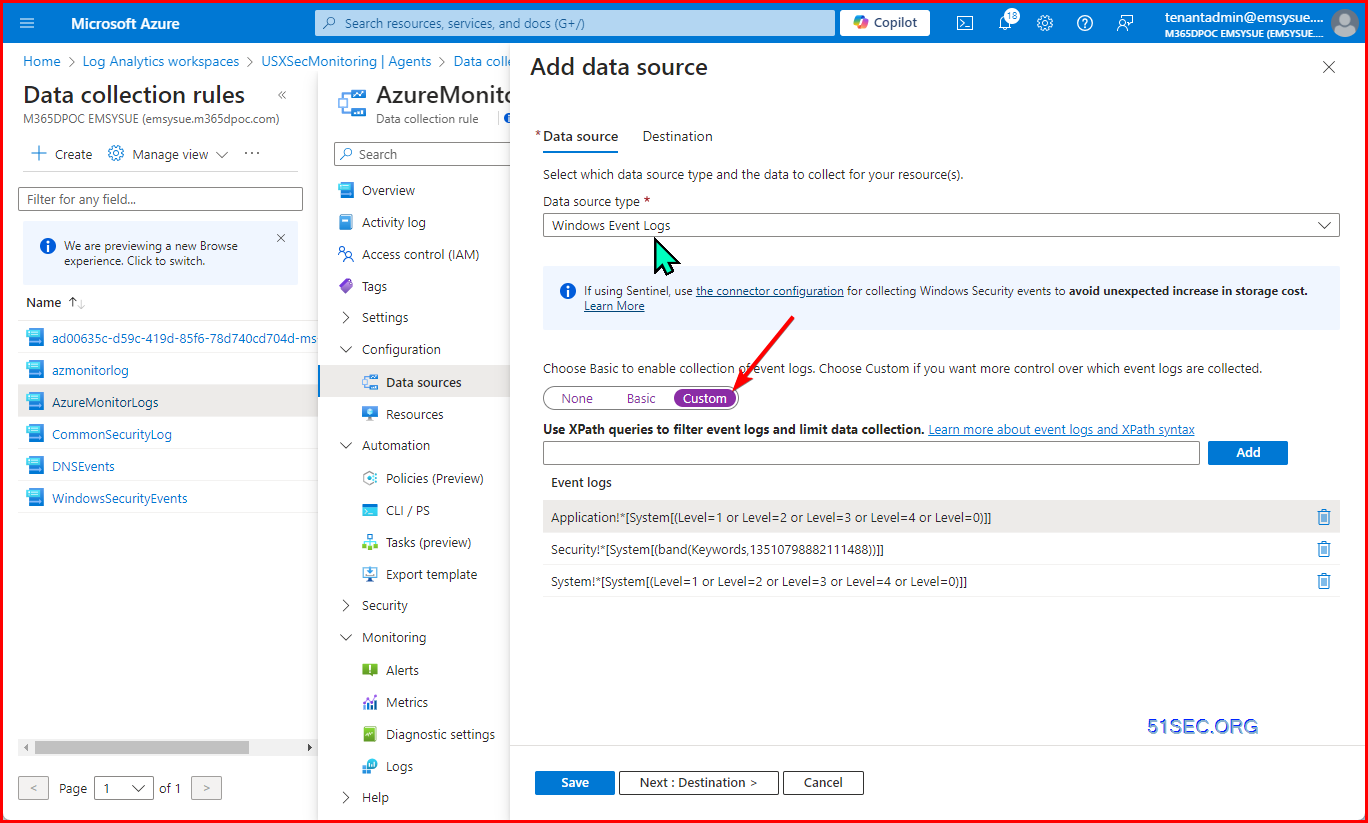
Examples:
- Application!*[System[(Level=1 or Level=2 or Level=3 or Level=4 or Level=0)]]
- Security!*[System[(band(Keywords,13510798882111488))]]
- System!*[System[(Level=1 or Level=2 or Level=3 or Level=4 or Level=0)]]
https://github.com/kphillip1/azure-soc-honeynet/blob/main/Xpath.txt
// Windows Defender Malware Detection XPath Query
- Microsoft-Windows-Windows Defender/Operational!*[System[(EventID=1116 or EventID=1117)]]
// Windows Firewall Tampering Detection XPath Query
- Microsoft-Windows-Windows Firewall With Advanced Security/Firewall!*[System[(EventID=2003)]]
Onboard Key Vault Logs
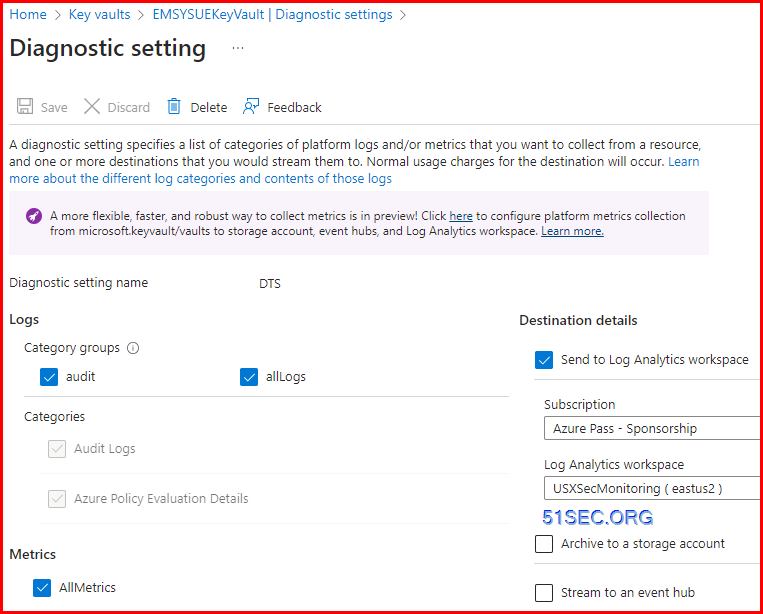
Check table: AzureDiagnostics
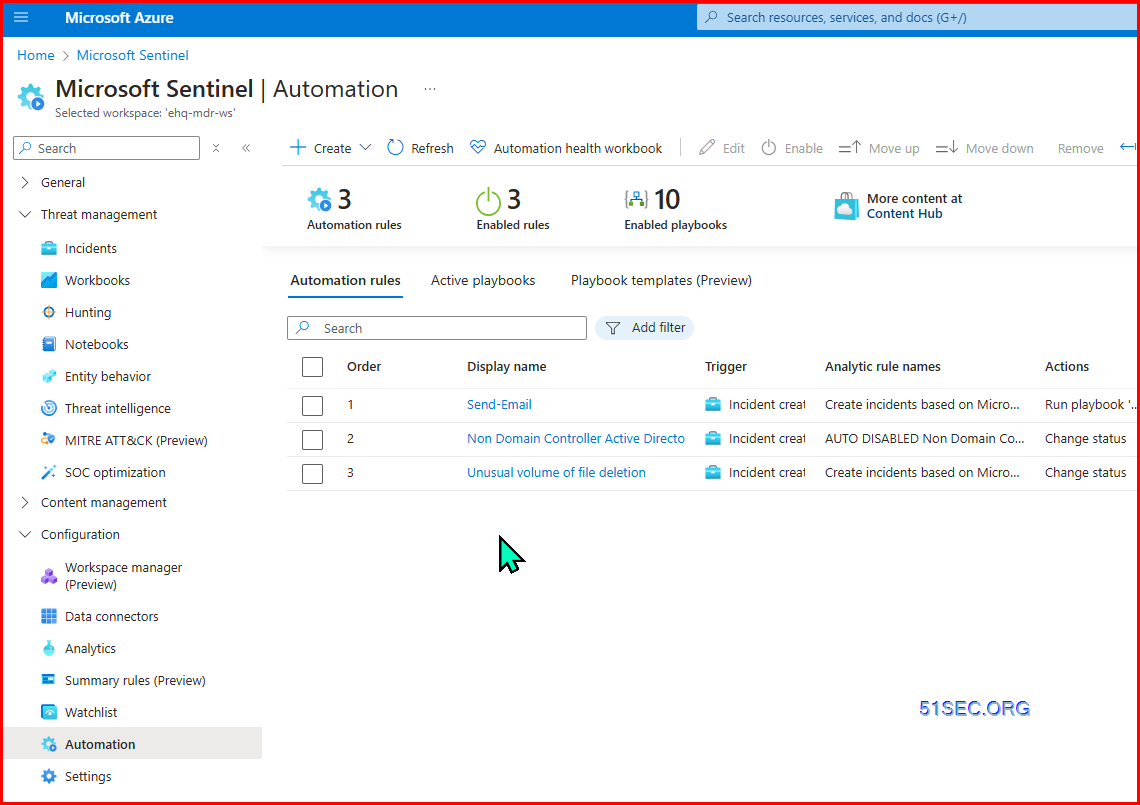
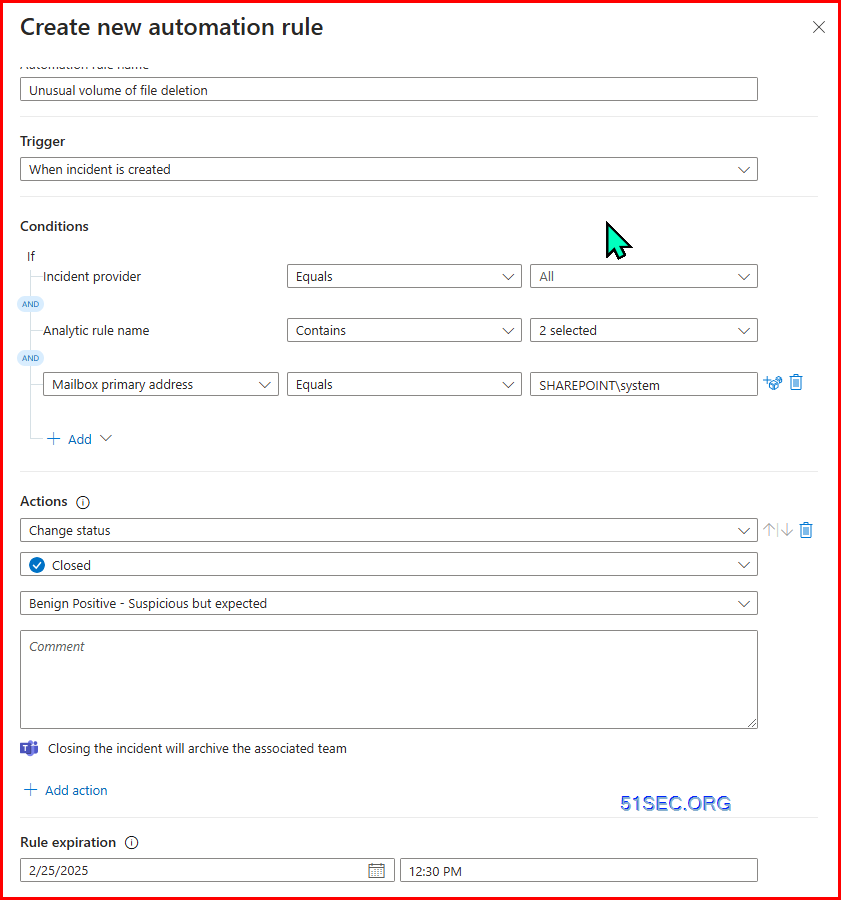
Microsoft Sentinel | Automation
Automation Rule
SOAR
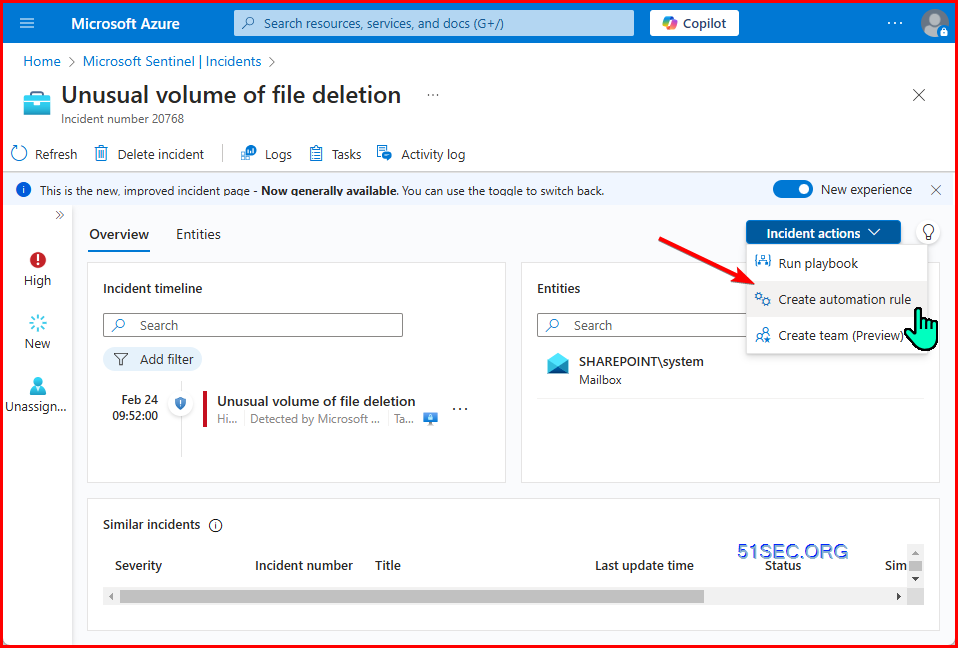
From incident detail, create automation rule:
Analytic Rules Limitation:
1. NRT rules - maximum 50
2. Scheduled Rules - Maximum 512
Playbook:
logic flow,


No comments:
Post a Comment