Here is a summary for the ways to do it.
1. Install a local firewall
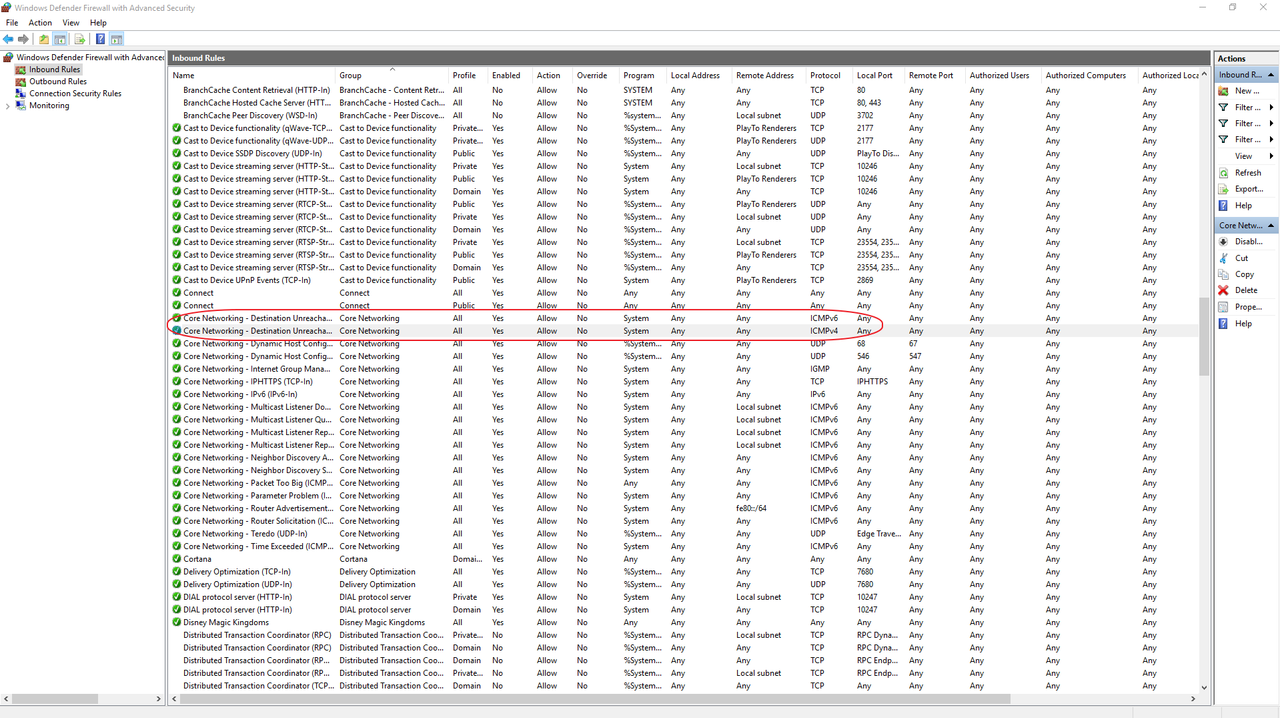
You could always try installing a firewall that blocks outgoing traffic or use the Windows Firewall. When the traffic is generated, it could prompt you asking whether you want to allow it or not. In many cases, it will tell you what application is generating the traffic.
2. Commands
2.1 Netstat command
Netstat command is good for tcp / udp traffic.
for example: netstat -tabn 10 | find ":80"
NETSTAT [-a] [-b] [-e] [-f] [-n] [-o] [-p proto] [-r] [-s] [-t] [interval]
-a Displays all connections and listening ports.
-b Displays the executable involved in creating each connection or
listening port. In some cases well-known executables host
multiple independent components, and in these cases the
sequence of components involved in creating the connection
or listening port is displayed. In this case the executable
name is in [] at the bottom, on top is the component it called,
and so forth until TCP/IP was reached. Note that this option
can be time-consuming and will fail unless you have sufficient
permissions.
-e Displays Ethernet statistics. This may be combined with the -s
option.
-f Displays Fully Qualified Domain Names (FQDN) for foreign
addresses.
-n Displays addresses and port numbers in numerical form.
-o Displays the owning process ID associated with each connection.
-p proto Shows connections for the protocol specified by proto; proto
may be any of: TCP, UDP, TCPv6, or UDPv6. If used with the -s
option to display per-protocol statistics, proto may be any of:
IP, IPv6, ICMP, ICMPv6, TCP, TCPv6, UDP, or UDPv6.
-r Displays the routing table.
-s Displays per-protocol statistics. By default, statistics are
shown for IP, IPv6, ICMP, ICMPv6, TCP, TCPv6, UDP, and UDPv6;
the -p option may be used to specify a subset of the default.
-t Displays the current connection offload state.
interval Redisplays selected statistics, pausing interval seconds
between each display. Press CTRL+C to stop redisplaying
statistics. If omitted, netstat will print the current
configuration information once.
But to icmp traffic, it only can show statistics. It won't be able to show the process name, just like it does udp/tcp traffic.
C:\test>netstat -s -p icmp
ICMPv4 Statistics
Received Sent
Messages 3794 20504
Errors 0 0
Destination Unreachable 39 484
Time Exceeded 3 0
Parameter Problems 0 0
Source Quenches 0 0
Redirects 0 0
Echo Replies 3750 2
Echos 2 20018
Timestamps 0 0
Timestamp Replies 0 0
Address Masks 0 0
Address Mask Replies 0 0
Router Solicitations 0 0
Router Advertisements 0 0
2.2 Windows Sysinternals Suite tools
Windows sysinternals suite provides some useful tools to show which process is using certain dll file which usually relates to icmp traffic.
We can use listdlls or process explorer to determine which process has these libraries loaded. Suspend them one by one and note when the ICMP traffic stops.
C:\Documents and Settings\user>listdlls -d icmp

ListDLLs v3.1 - List loaded DLLs
Copyright (C) 1997-2011 Mark Russinovich
Sysinternals - www.sysinternals.com

----------------------------------------------------------------
Belkinwcui.exe pid: 2484
Command line: "C:\Program Files\Belkin\F5D7050v3\Belkinwcui.exe"

Base        Size      Path
0x74290000  0x4000    ICMP.DLL
Use the tasklist command (see below) to determine which processes have iphlpali.dll or icmp.dll loaded (for example, I find ping.exe uses only iphlpapi.dll while tarcert.exe uses both)
C:\test>tasklist /M Iphlpapi.dll
Image Name PID Modules
========================= ======== ============================================
chrome.exe 8568 IPHLPAPI.DLL
chrome.exe 168 IPHLPAPI.DLL
chrome.exe 7600 IPHLPAPI.DLL
chrome.exe 3620 IPHLPAPI.DLL
chrome.exe 6820 IPHLPAPI.DLL
chrome.exe 8616 IPHLPAPI.DLL
chrome.exe 7576 IPHLPAPI.DLL
chrome.exe 6624 IPHLPAPI.DLL
chrome.exe 8128 IPHLPAPI.DLL
taskhost.exe 7048 IPHLPAPI.DLL
splwow64.exe 7440 IPHLPAPI.DLL
chrome.exe 8572 IPHLPAPI.DLL
chrome.exe 8144 IPHLPAPI.DLL
chrome.exe 6164 IPHLPAPI.DLL
OSPPSVC.EXE 8048 IPHLPAPI.DLL
PING.EXE 4272 IPHLPAPI.DLL
C:\test>tasklist /M Iphlpapi.dll
Image Name PID Modules
========================= ======== ============================================
lsass.exe 604 IPHLPAPI.DLL
svchost.exe 912 IPHLPAPI.DLL
svchost.exe 968 IPHLPAPI.DLL
svchost.exe 992 IPHLPAPI.DLL
svchost.exe 336 IPHLPAPI.DLL
svchost.exe 608 IPHLPAPI.DLL
svchost.exe 1228 iphlpapi.dll
svchost.exe 1320 IPHLPAPI.DLL
wlanext.exe 1352 IPHLPAPI.DLL
spoolsv.exe 1560 IPHLPAPI.DLL
btwdins.exe 1860 IPHLPAPI.DLL
OfficeClickToRun.exe 1884 IPHLPAPI.DLL
svchost.exe 2004 IPHLPAPI.DLL
EvtEng.exe 2036 IPHLPAPI.DLL
SwiCardDetect64.exe 2588 IPHLPAPI.DLL
WmiPrvSE.exe 1704 IPHLPAPI.DLL
svchost.exe 4316 IPHLPAPI.DLL
explorer.exe 4108 IPHLPAPI.DLL
BTStackServer.exe 5632 IPHLPAPI.DLL
svchost.exe 1868 IPHLPAPI.DLL
chrome.exe 8536 IPHLPAPI.DLL
chrome.exe 7816 IPHLPAPI.DLL
TRACERT.EXE 9000 iphlpapi.DLL
C:\test>tasklist /M icmp.dll
Image Name PID Modules
========================= ======== ============================================
TRACERT.EXE 9000 icmp.dll
3. Netsh command to do low level capture network traffic
You can use the new built-in ETL tracing available at NDIS layer. All you need to do is to start a new ETL packet capturing session.This method doesn't even require you to install any sniffing software (Network Monitor/Wireshark etc). You can use this option for general packet capturing on Windows 7/Windows 2008 R2 as well:
netsh trace start capture=yes tracefile=c:\test\c1.etl
netsh trace stop

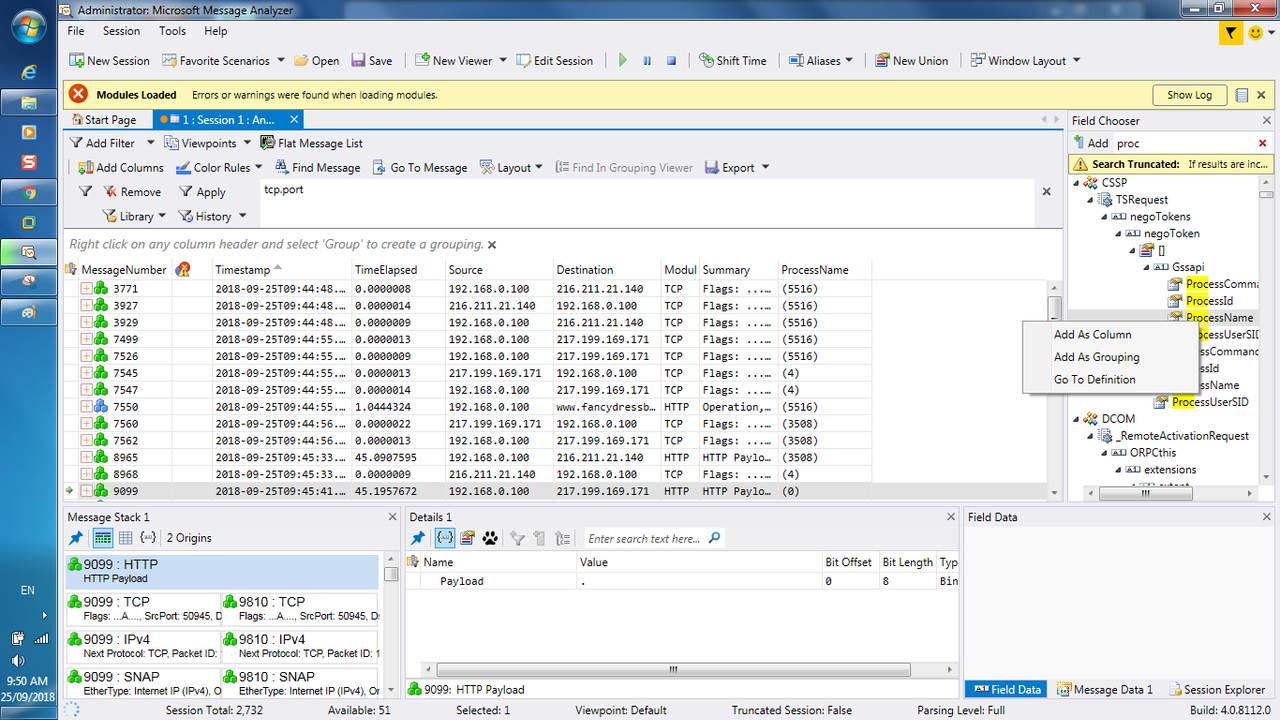
4. Microsoft Message Analyzer
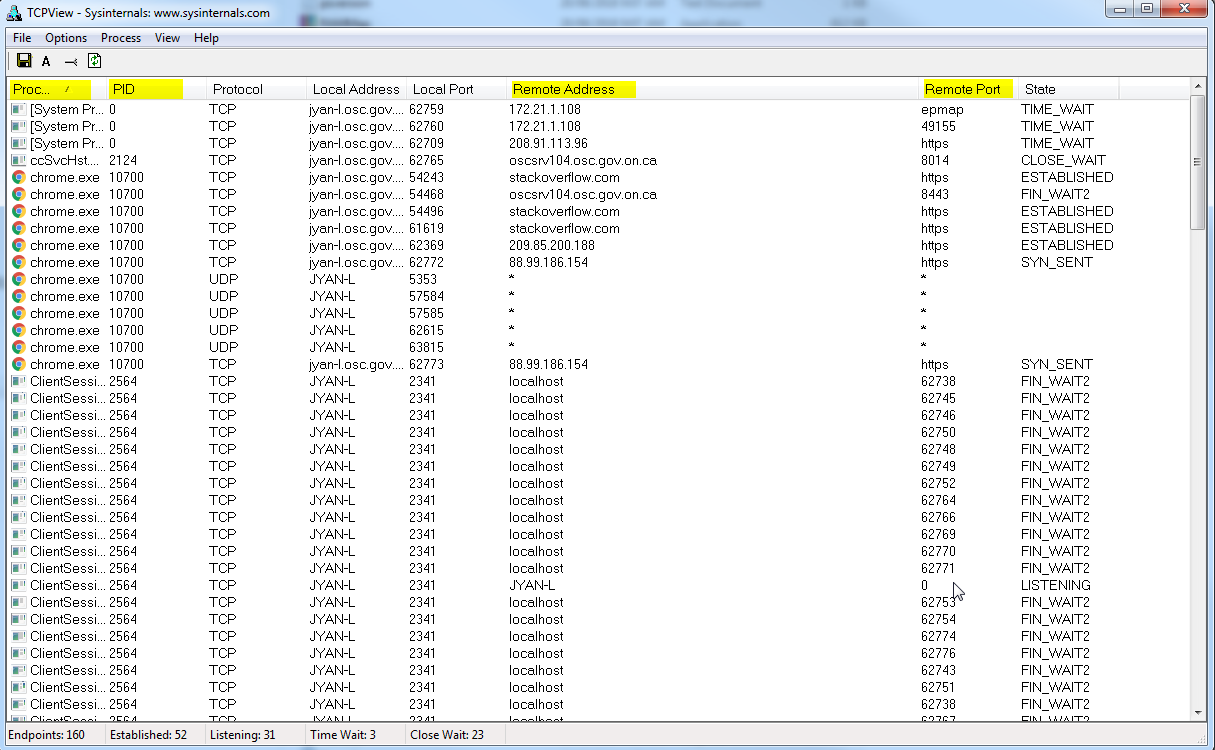
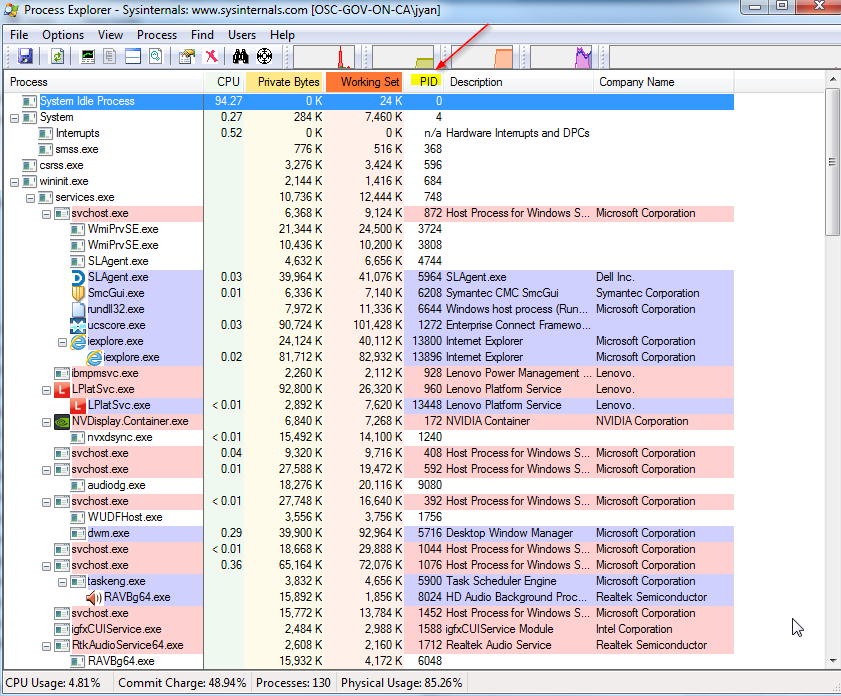
5. Some Windows Sysinternals Suite tools
TCPVIEW
Procexp
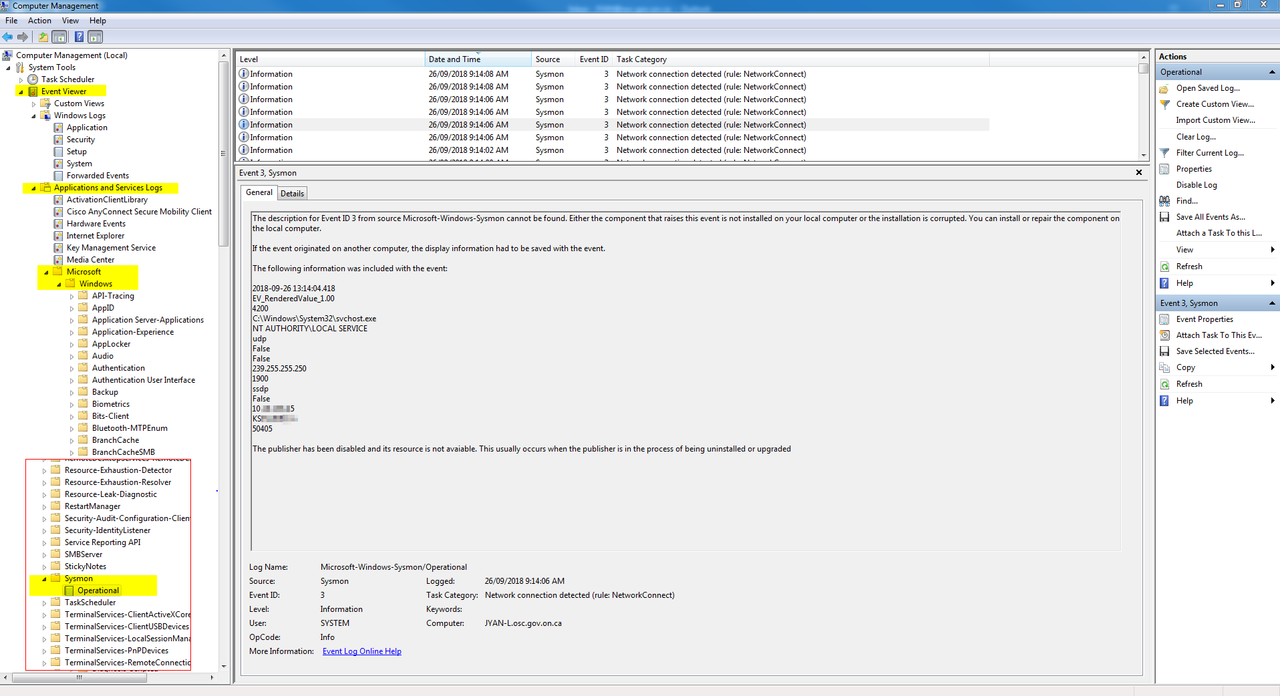
Sysmon to collect network connections
Installation:
sysmon -i -accepteula [options]
- Extracts binaries into %systemroot%
- Registers event log manifest
- Enables default configuration
Viewing and updating configuration:
sysmon -c [options]
- Updates take effect immediately
- Options can be basic options or a configuration file
Register event manifest for viewing logs only:
sysmon -m
Uninstall:
sysmon -u
C:\ISOScripting>sysmon64 -i -accepteula


System Monitor v7.02 - System activity monitor
Copyright (C) 2014-2018 Mark Russinovich and Thomas Garnier
Sysinternals - www.sysinternals.com

Sysmon64 installed.
SysmonDrv installed.
Starting SysmonDrv.
SysmonDrv started.
Starting Sysmon64..
Sysmon64 started.
C:\ISOScripting>sysmon64 -c


System Monitor v7.02 - System activity monitor
Copyright (C) 2014-2018 Mark Russinovich and Thomas Garnier
Sysinternals - www.sysinternals.com

Current configuration:
 - Service name:                  Sysmon64
 - Driver name:                   SysmonDrv
 - HashingAlgorithms:             SHA1
 - Network connection:            disabled
 - Image loading:                 disabled
 - CRL checking:                  disabled
 - Process Access:                disabled

No rules installed
C:\ISOScripting>sysmon64 -c -n


System Monitor v7.02 - System activity monitor
Copyright (C) 2014-2018 Mark Russinovich and Thomas Garnier
Sysinternals - www.sysinternals.com

Configuration updated.


C:\ISOScripting>sysmon64 -c


System Monitor v7.02 - System activity monitor
Copyright (C) 2014-2018 Mark Russinovich and Thomas Garnier
Sysinternals - www.sysinternals.com

Current configuration:
 - Service name:                  Sysmon64
 - Driver name:                   SysmonDrv
 - HashingAlgorithms:             SHA1
 - Network connection:            enabled
 - Image loading:                 disabled
 - CRL checking:                  disabled
 - Process Access:                disabled

No rules installed
C:\ISOScripting>Sysmon64.exe -u


System Monitor v7.02 - System activity monitor
Copyright (C) 2014-2018 Mark Russinovich and Thomas Garnier
Sysinternals - www.sysinternals.com

Stopping Sysmon64.
Sysmon64 stopped.
Sysmon64 removed.
Stopping SysmonDrv.
SysmonDrv stopped.
SysmonDrv removed.
Removing service files................
Failed to delete C:\windows\Sysmon64.exe
C:\ISOScripting>sysmon64 /?


System Monitor v7.02 - System activity monitor
Copyright (C) 2014-2018 Mark Russinovich and Thomas Garnier
Sysinternals - www.sysinternals.com

Usage:
Install:    sysmon64 -i [<configfile>]
              [-h <[sha1|md5|sha256|imphash|*],...>] [-n [<process,...>]]
              [-l [<process,...>]
Configure:  sysmon64 -c [<configfile>]
              [--|[-h <[sha1|md5|sha256|imphash|*],...>] [-n [<process,...>]]
              [-l [<process,...>]]]
Uninstall:  sysmon64 -u
  -c   Update configuration of an installed Sysmon driver or dump the
       current configuration if no other argument is provided. Optionally
       take a configuration file.
  -d   Specify the name of the installed device driver image.
       Configuration entry: DriverName.
       The service image and service name will be the same
       name of the Sysmon.exe executable image.
  -h   Specify the hash algorithms used for image identification (default
       is SHA1). It supports multiple algorithms at the same time.
       Configuration entry: HashAlgorithms.
  -i   Install service and driver. Optionally take a configuration file.
  -l   Log loading of modules. Optionally take a list of processes to track.
  -m   Install the event manifest (done on service install as well).
  -n   Log network connections. Optionally take a list of processes to track.
  -r   Check for signature certificate revocation.
       Configuration entry: CheckRevocation.
  -s   Print configuration schema definition of the specified version.
       Specify 'all' to dump all schema versions (default is latest).
  -u   Uninstall service and driver.

The service logs events immediately and the driver installs as a boot-start
driver to capture activity from early in the boot that the service will write
to the event log when it starts.

On Vista and higher, events are stored in "Applications and Services
Logs/Microsoft/Windows/Sysmon/Operational". On older systems, events are
written to the System event log.

If you need more information on configuration files, use the '-? config'
command. More examples are available on the Sysinternals website.

Specify -accepteula to automatically accept the EULA on installation,
otherwise you will be interactively prompted to accept it.

Neither install nor uninstall requires a reboot.

C:\ISOScripting>
Sysinternals from Web Browser:
Reference:
- http://randomuserid.blogspot.ca/2007/03/tracking-down-random-icmp-in-windows.html







No comments:
Post a Comment