Alerts are triggered in two ways:
- A correlation alert is triggered by a query that looks back over a specified time period to determine if alert threshold has been met. The Guardium Anomaly Detection Engine runs correlation queries on a scheduled basis. By default, correlation alerts do not log policy violations, but they can be configured to do that.
- A real-time alert is triggered by a security policy rule. The Guardium Inspection Engine component runs the security policy as it collects and analyzes database traffic in real time.
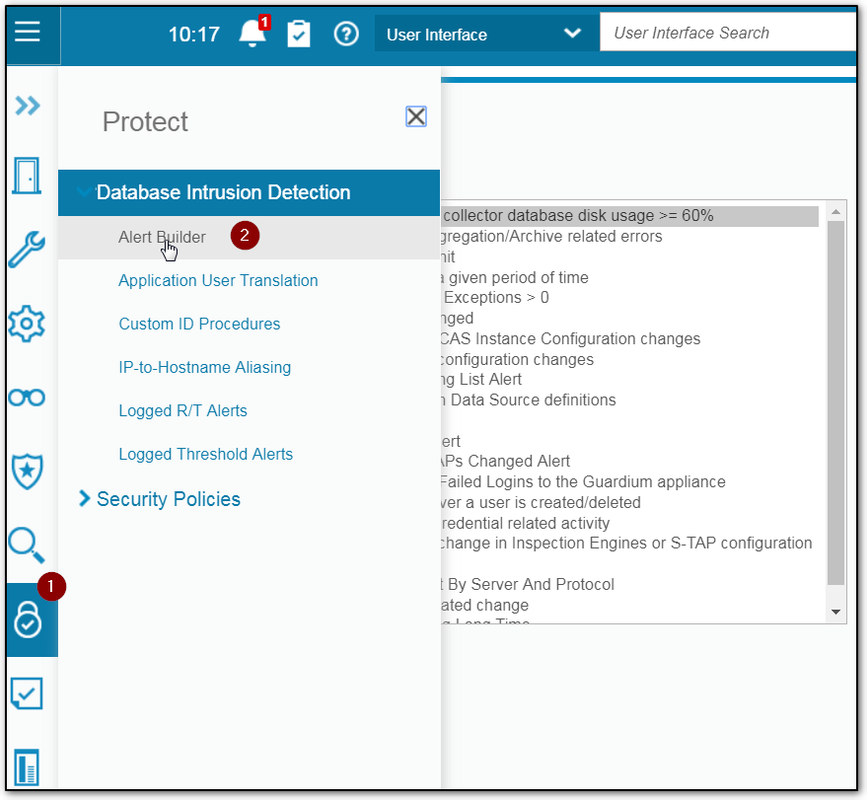
IBM Guardium - Protect - Database Intrusion Detection - Alert Builder
Create a Correlation Alert
- Click to open the Alert Finder.
- Click New in the Alerts Finder panel to display the Add Alert panel.
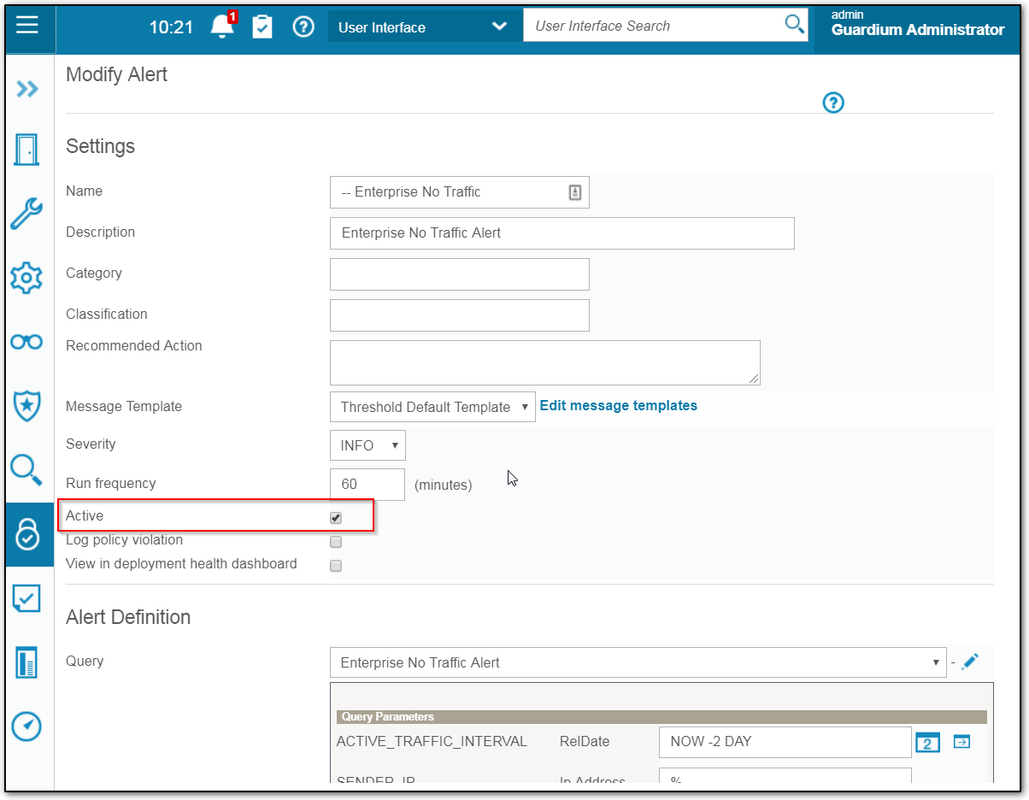
- In the Settings pane:
- Enter a unique name for the alert in the Name box. Do not include apostrophe characters in the alert name.
- Enter a short sentence that describes the alert in the Description box.
- Enter an optional category in the Category box.
- Enter an optional classification in the Classification box.
- For Recommended Action, the user can add free text as the recommended action for the specific alert.
- As in real-time alerts, the user can choose a template for the message that is sent in case the threshold alert fires. The template uses a predefined list of variables that are replaced with the appropriate value for the specific alert. The list of variables and a default template are detailed in the Named Templates section of the Global Profile help topic.
- Select a severity level from the Severity list. For an email alert, a setting of HIGH results in the email being flagged as HIGH.
- Enter the number of minutes between runs of the query in the Run Frequency field.
- Check Active activate the alert, or clear the box to save the alert definition without starting it running (it can be activated later). In a Central Manager environment, the alert will be activated (or stopped) on all managed units when this box is marked (or cleared). To disable the alert on a specific appliance in a Central Manager environment, use the Anomaly Detection panel of the Administrator Console.
- Check Log Policy Violation to log a policy violation when this alert is triggered. By default, correlation alerts are logged in the Alert Tracking domain only. By marking this box, correlation alerts and real-time alerts (issued by the data access security policy) can be viewed together, in the Policy Violations domain.
- Check View in deployment health dashboard if you want this alert included in the deployment health dashboard.
- In the Alert Definition panel:
- Select the query to run for this alert. The list of queries displayed includes all queries defined that:
- Contain at least one date field (timestamp) - a timestamp field is required
- Contain a Count field - a count field is required
- Can be accessed by your Guardium user account
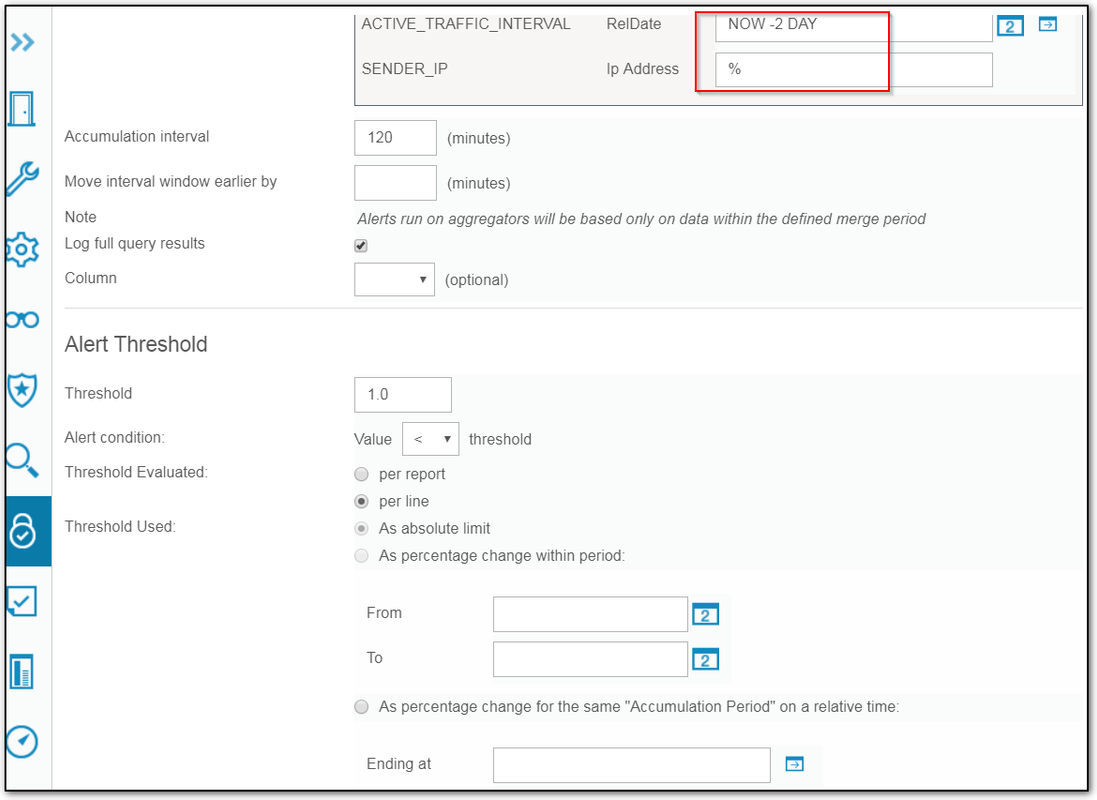
- If the selected query contains run-time parameters, a Query Parameters panel appears in the Alert Definition pane. Supply parameter values as appropriate for your application.Troubleshooting tips
- If a custom query has been created in any Query-Report Builder, and it does not appear in the Query list, then make sure that the custom query has a timestamp (date field).
- After selecting a query from the Query list in the Alert Definition panel of the Add Alert screen, and there is need to edit the query (Edit icon), and the query can not be edited, then go to the Query-Report builder to edit the query.
- In the Accumulation Interval box, enter the length of the time interval (in minutes) that the query should examine in the audit repository, counting back from the current time (for example, enter 10 to examine the last 10 minutes of data).
- Move interval window earlier by: GBDI data is not available immediately. Use this field to move the accumulation interval backwards in time, in minutes, so that the entire time interval of your query has data. Usually 120 minutes is sufficient.Note: Alerts that run on aggregators are based only on data within the defined merge period.
- Check the Log Full Query Results box to have the full report logged with the alert.
- Select the query to run for this alert. The list of queries displayed includes all queries defined that:
- If the selected query contains one or more columns of numeric data, select one of those columns to use for the test. The default, which will be the last item listed, is the last column for the query, which is always the count of occurrences aggregated in that row.
- In the Alert Threshold pane, define the threshold at which a correlation alert is to be generated, as follows:
- In the Threshold field, enter a threshold number that applies as described by the remaining fields in the panel.
- In the Alert condition value list, select an operator indicating how the report value is to relate to the threshold to produce an alert (greater than, greater than or equal to, less than, etc.).
- Select per report if the threshold number applies to a report total, or select per line if the threshold applies to a single line of the report (the report being the output of the selected query, run by looking back over the specified accumulation time).If there is no data during the specified Accumulation Interval:If the threshold is per report, the value for that interval is 0 (zero), and an alert is generated if the threshold condition is met (for example, if the condition specified is “Alert when value is < 1”).If the threshold is per line, no alert is generated, regardless of the specified condition (this is because there are no lines of output).
- Select As absolute limit to indicate that the threshold entered is an absolute number or select As a percentage change within period to indicate that the threshold represents a percentage of change within the time period identified in the From and To fields.If the As percentage change within period option is selected, use the date picker controls to select the From and To dates.If the As percentage change for the same "Accumulation Period" on a relative time is selected , one relative date will be entered and the alert will execute the query for the current period and for the relative period (using the same interval), and will check the values as a percentage of the base period value.
Note: If relative period is used, each time the alert is checked it will execute the query twice, once for the current period and once for the relative period.
- Indicate in the Notification Frequency box how often (in minutes) the Alert Receivers should be notified when the alert condition has been satisfied.
- Click Save to save the alert definition.Note: You cannot assign receivers or roles, or enter comments until the definition has been saved.
- In the Alert Receivers panel, optionally designate one or more persons or groups to be notified when this alert condition is satisfied. To add a receiver, click the Add Receiver button to open the Add Receiver Selection panel.Note: If the receiver of an alert is the admin user then admin needs to be assigned an email for the alert to fire.Note: An additional receiver for threshold alerts is Owner (the owner/s of the database). If the query associated with the alert contains Server IP and Service name and if the alert is evaluated Per Row, then the receiver can be Owner. The alert notification must have: Alert Notification Type: Mail, Alert User ID: 0, Alert Destination: Owner. See Alerting Actions in Policiesfor additional receivers for real-time alerts.
- Optionally click Roles to assign roles for the alert.
- Optionally click Comments to add comments to the definition.
- Click Apply and then Done when you have finished.
Common Use Cases
Regular Expresson Examples (RegEx)
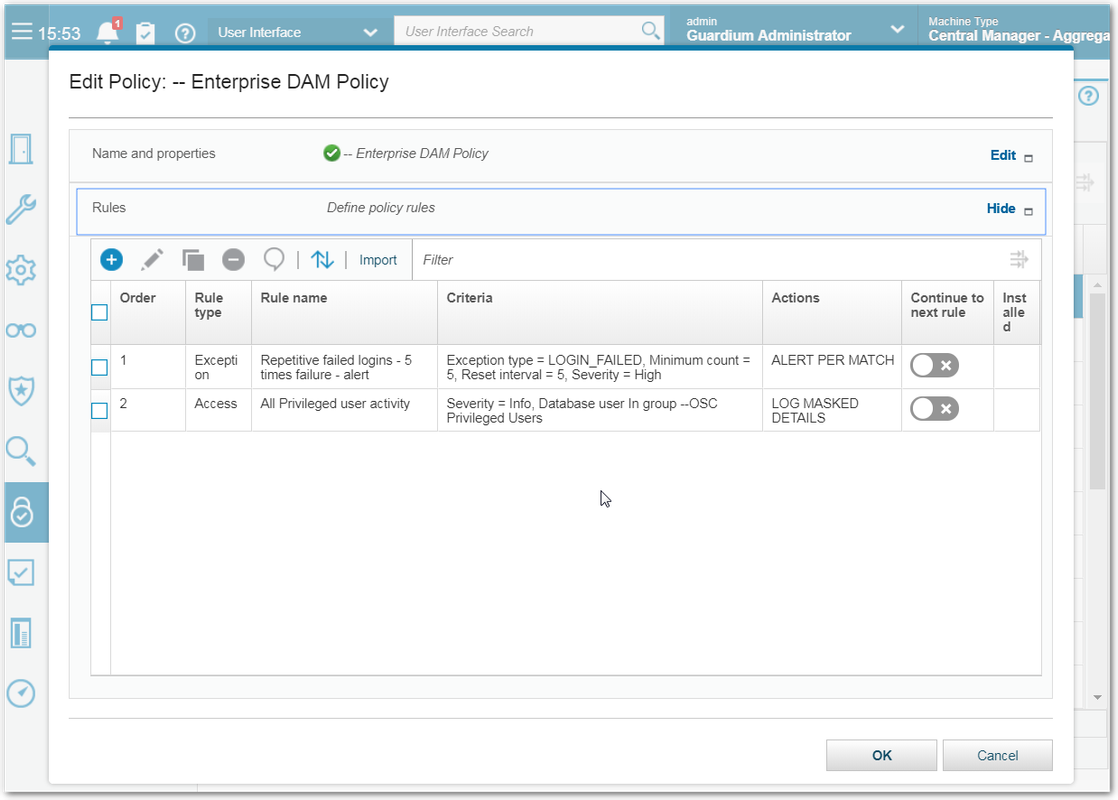
DAM Policy Use Cases
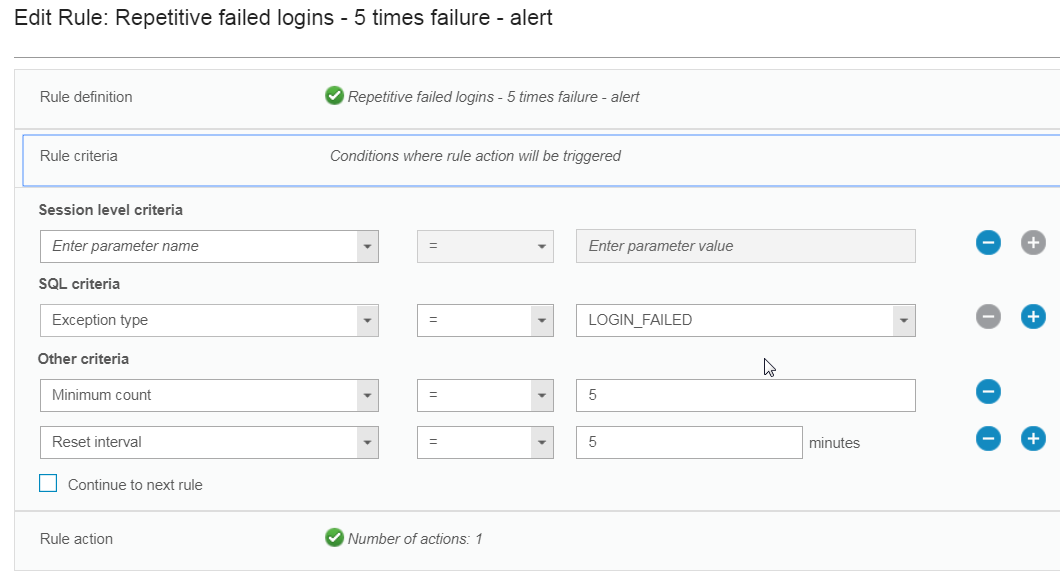
1. Login failures, repetitive login failures
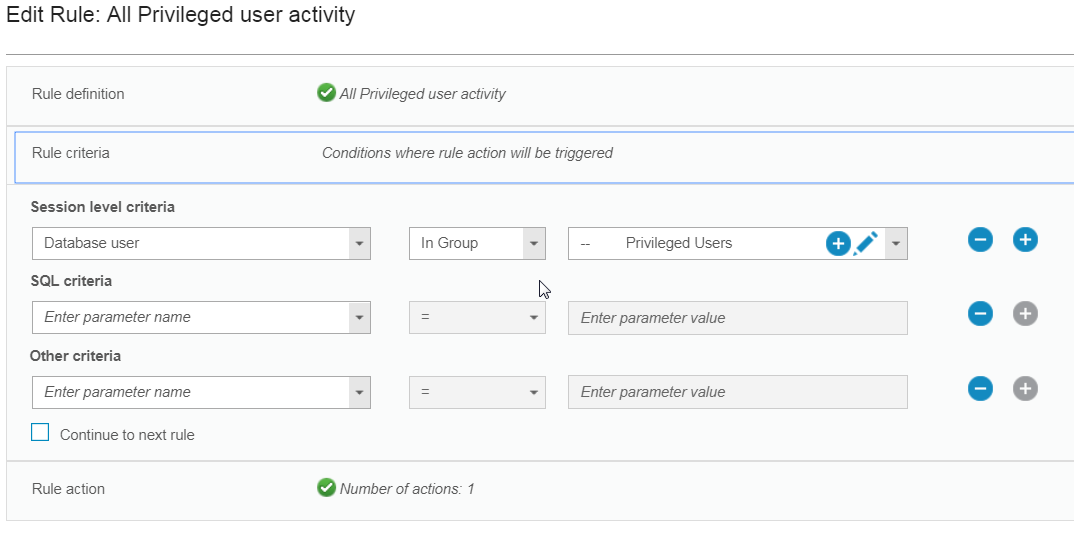
2. Privileged user activity (DML, DDL, DCL) to sensitive objects (especially during non-business hours)
3. Use of service accounts (application accounts) from non application servers
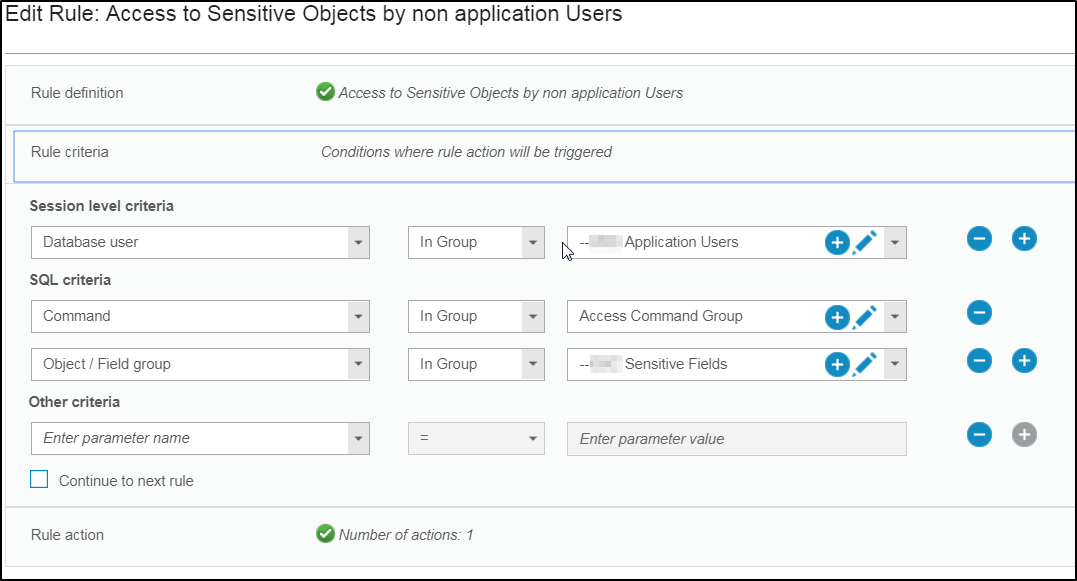
4. Access (selects) to sensitive objects by non application users (PCI)
5. Account creation activity (create user, sp_adduser)
6. Escalation of privileges, grant commands to sensitive objects (PCI), grant commands (SOX)
7. SQL injection, monitoring of risk indicative database exception
8. Large data movements
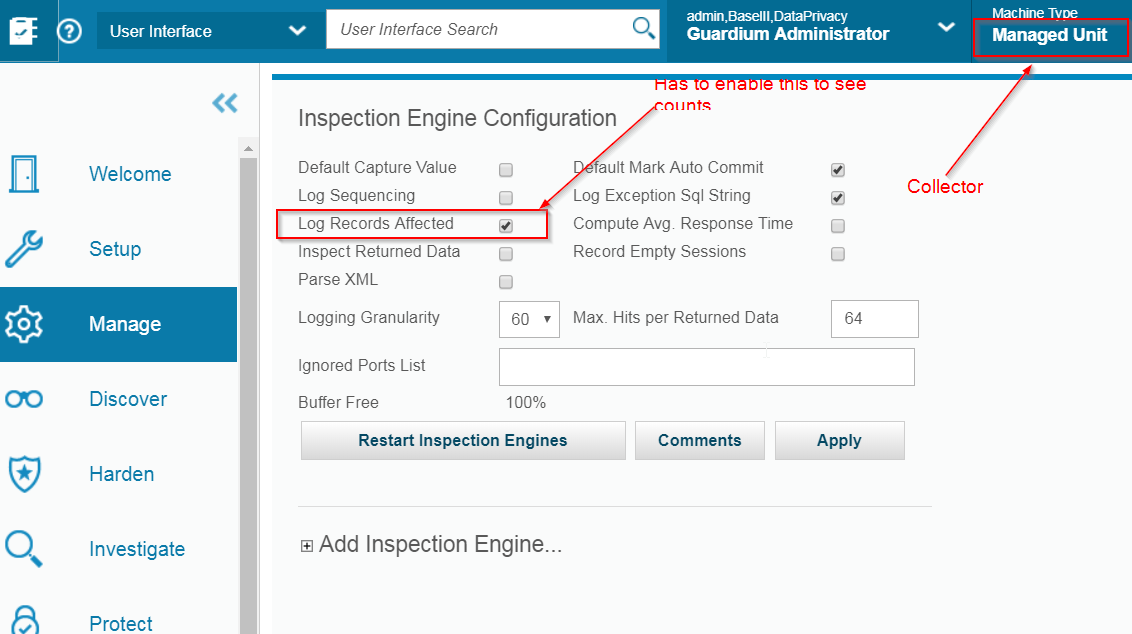
You only can do data counts, not by percentage. This example shows we are going to monitor 500+ records movements.
To enable this feature, it require enable a count change on Collector's Inspection Engine.
9. Select * against sensitive objects
Security Policies Builder
A security policy contains an ordered set of rules to be applied to the observed traffic between database clients and servers. Each rule can apply to a request from a client, or to a response from a server. Multiple policies can be defined and multiple policies can be installed on a Guardium appliance at the same time.Each rule in a policy defines a conditional action. The condition tested can be a simple test - for example it might check for any access from a client IP address that does not belong to an Authorized Client IPs group. Or the condition tested can be a complex test that considers multiple message and session attributes (database user, source program, command type, time of day, etc.), and it can be sensitive to the number of times the condition is met within a specified time frame.
The action triggered by the rule can be a notification action (e-mail to one or more recipients, for example), a blocking action (the client session might be disconnected), or the event might simply be logged as a policy violation. Custom actions can be developed to perform any tasks necessary for conditions that may be unique to a given environment or application.
A policy violation is logged each time that an alert or log-only action is triggered. Optionally, the SQL that triggered the rule (including data values) can be recorded with the policy violation.
Create a new policy
Add rules
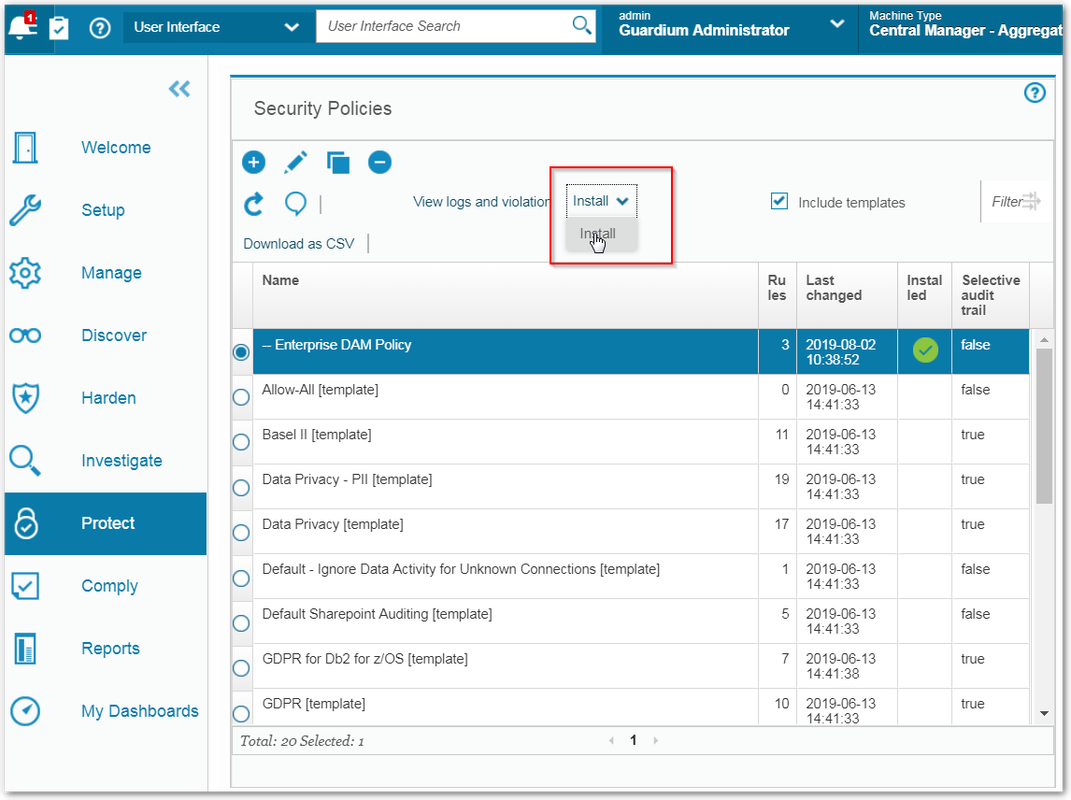
Install policyInstall policies by selecting a policy from the Security Policies window and clicking Install > Install. Select the desired Installation action and click OK to install the policy. Installed policies are indicated by a green check mark in the Installed column.
Classifications
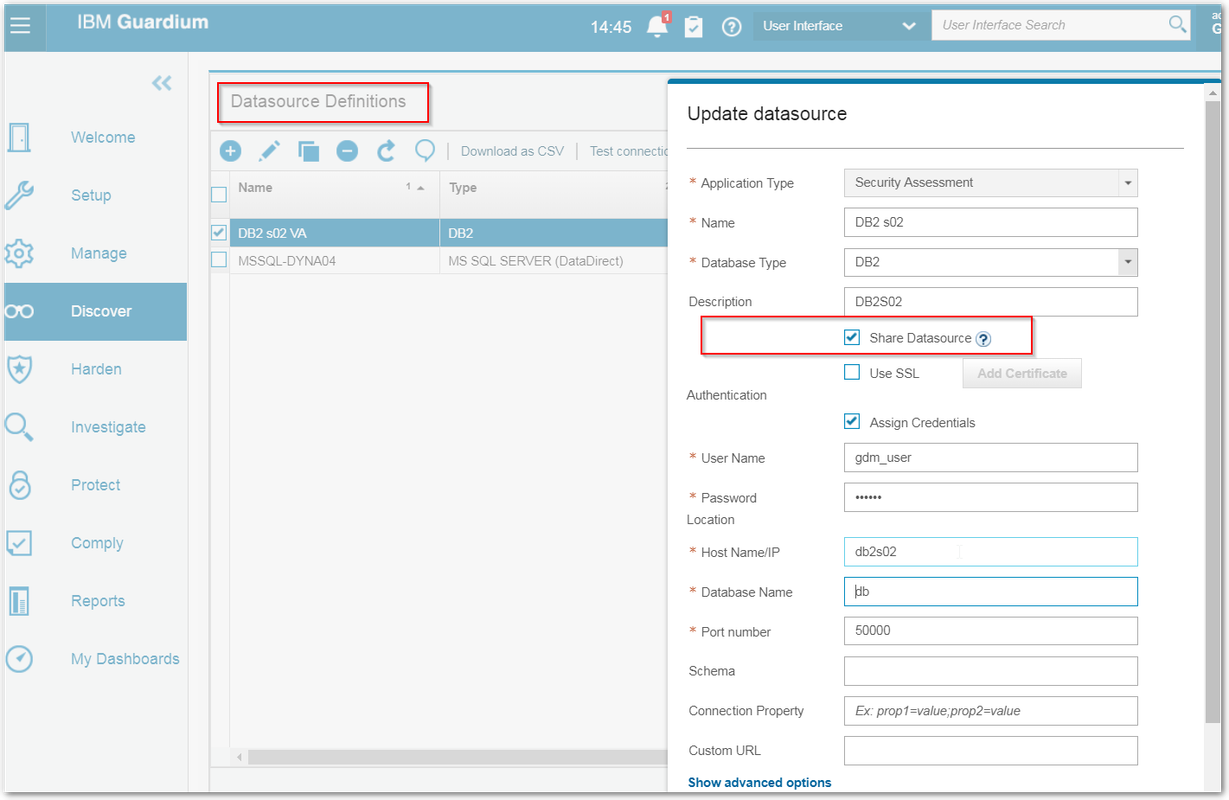
Datasource Definitions
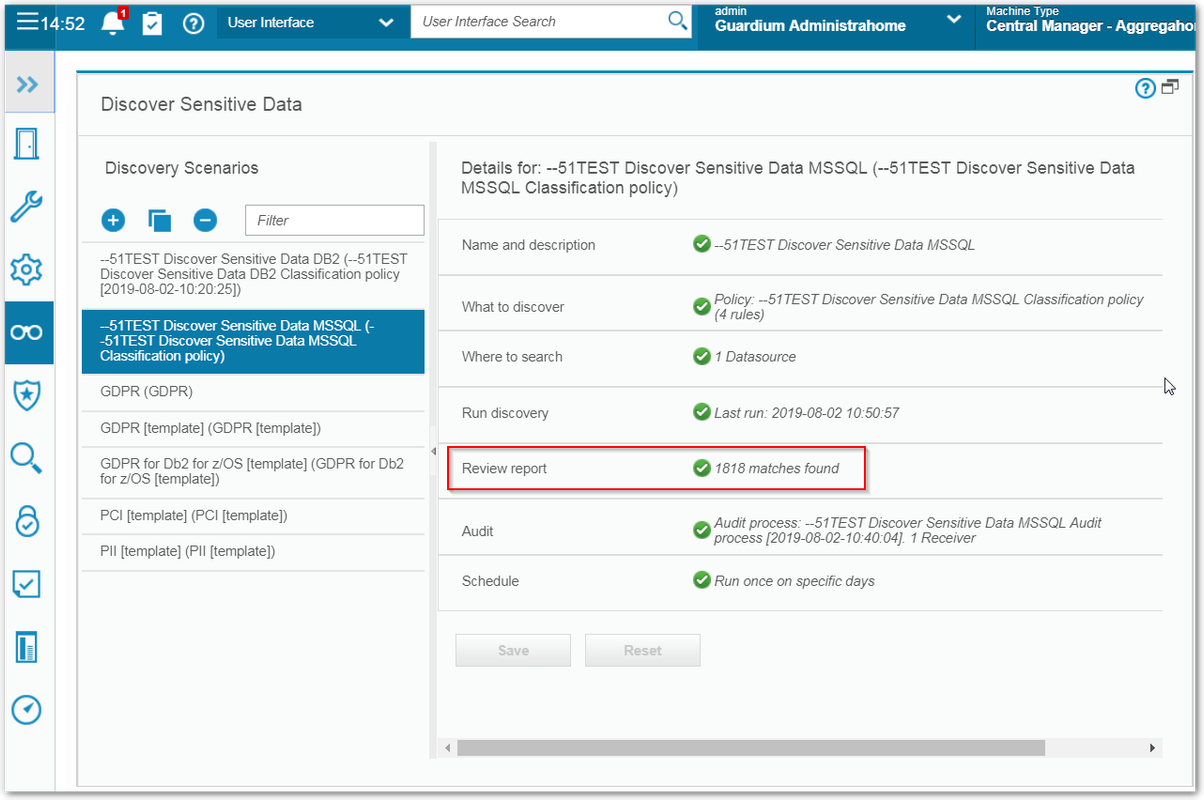
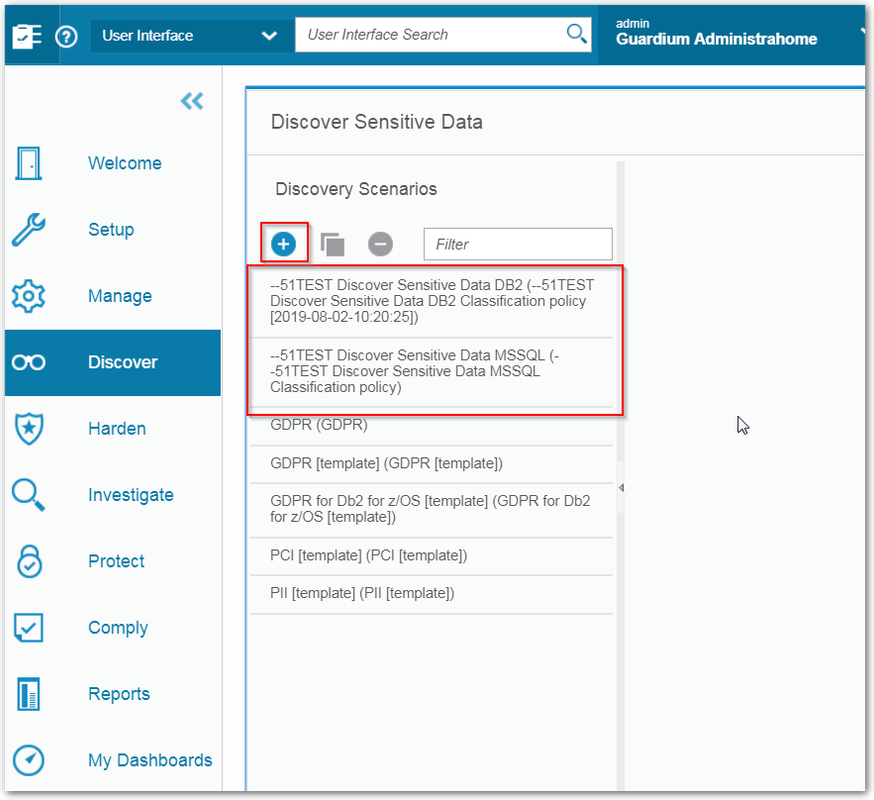
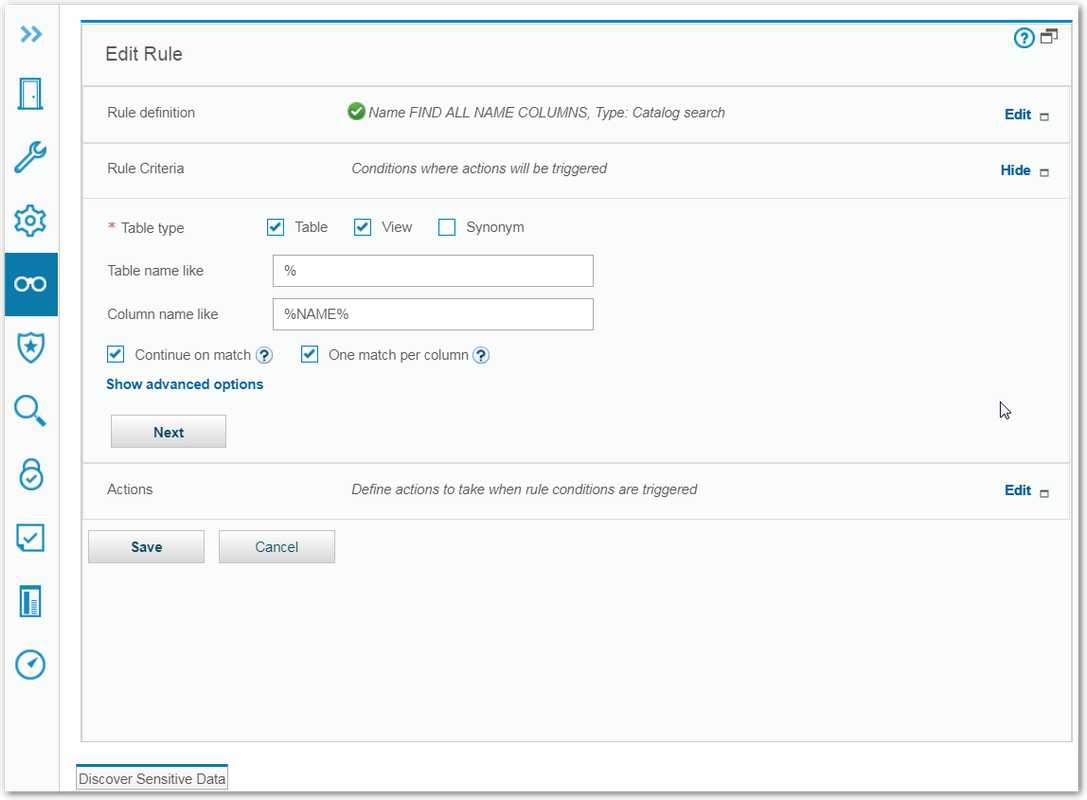
Discover Sensitive Data - Discovery Scenarios











No comments:
Post a Comment