 I was working on IBM Guardium project to onboard some DB servers into system.
To demonstrate how much work it will be , I created this tasks list. It is a draft for my own usage. I am sharing it out through my blog post. Hopefully there are more feedback coming to get this list fulfilled.
It will only cover three main requirements, creating a new Collector, DB Vulnerability Assessment, and Data Security Policy.
Task List
Note: This list is still to keep updating.
| No. | Tasks | Sub Tasks | Progress | ETA |
| 1 | Install a new collector | One Week | ||
| 1.1 | Prepare Environment for Installing new collector: IP Address, Network Mask, Default Route, DNS, NTP, SMTP | |||
| 1.2 | Set up virtual appliance for new collector - same specification as existing one (192.23.1.9) | |||
| 1.3 | Download same version image as existing collector, load guardium image do standard installation | |||
| 1.4 | set up initial and basic configuration through command line: IP, Gateway, DNS, NTP, SMTP, change default password, timezone, reboot system | |||
| 1.5 | install license key, apply patches, snapshot system. | |||
| 2 | New Collector Integration with Guardium Mgmt Server (192.23.1.8) | One Week | ||
| 2.1 | Verification CLI installation | |||
| 2.2 | Log Aggregating to Aggreator / Central Manager | |||
| 2.3 | Configure log shippment from new collector to Aggregator | |||
| 2.4 | AD Integration, Configuration sync/push from Aggregator to Collector | |||
| 2.5 | System backup Configuration | |||
| 3 | Install GIM Agent / Stap on DB Servers | Two Weeks | ||
| 3.1 | Generate Installation Scripts for each server and DB | |||
| 3.2 | Create user and group on DB Servers | |||
| 3.3 | Install GIM Agent and Stap software | |||
| 3.4 | Verification GIM and Stap installation | |||
| 4 | Create System Monitor Alert for new DB and Collector | One Week | ||
| 4.1 | monitor S-tap on both servers | |||
| 4.2 | monitor collector status | |||
| 4.3 | Monitor collector local disk usage | |||
| 4.4 | Data Archive Policy , Data Export / Import / Purge Configuration | |||
| 5 | VA | Two Weeks | ||
| 5.1 | Datasource Definition | |||
| 5.2 | Discover Sensitive Data (Optional) , Discover Database (Optional) | |||
| 5.3 | Buiding DB2 / MS sQL Security Assessment | |||
| 5.4 | Verify results and schedule Audit reports | |||
| 5.5 | Review results with DBAs (Hardening policy) | |||
| 6 | Policy for Data Security | Three Weeks | ||
| 6.1 | collecting Sensitive Fields | |||
| 6.2 | Collecting Priviledge Accounts | |||
| 6.3 | Define Use Cases (Optional) - Same Use Cases | |||
| 6.4 | Create same Data Security Policy as Pilot projects but for different DBs. | |||
| 6.5 | Create alerts / reports etc. | |||
| 6.6 | Use Cases Testing / Tuning | |||
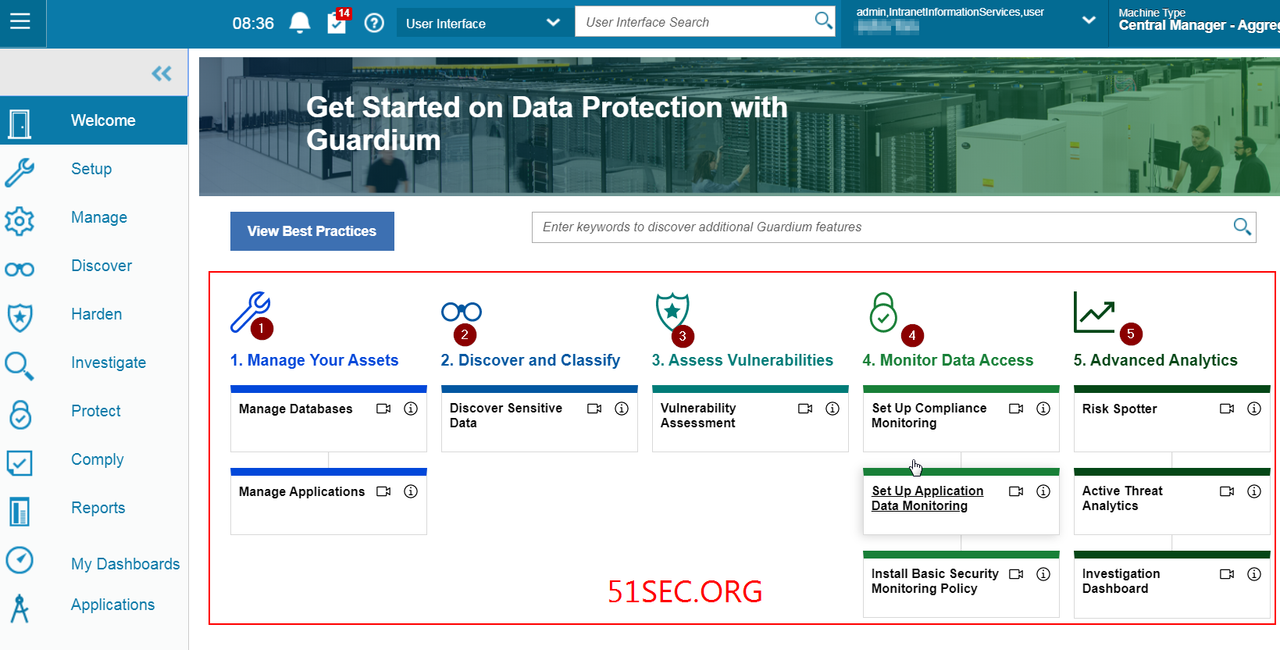
1. Manage Your Assets
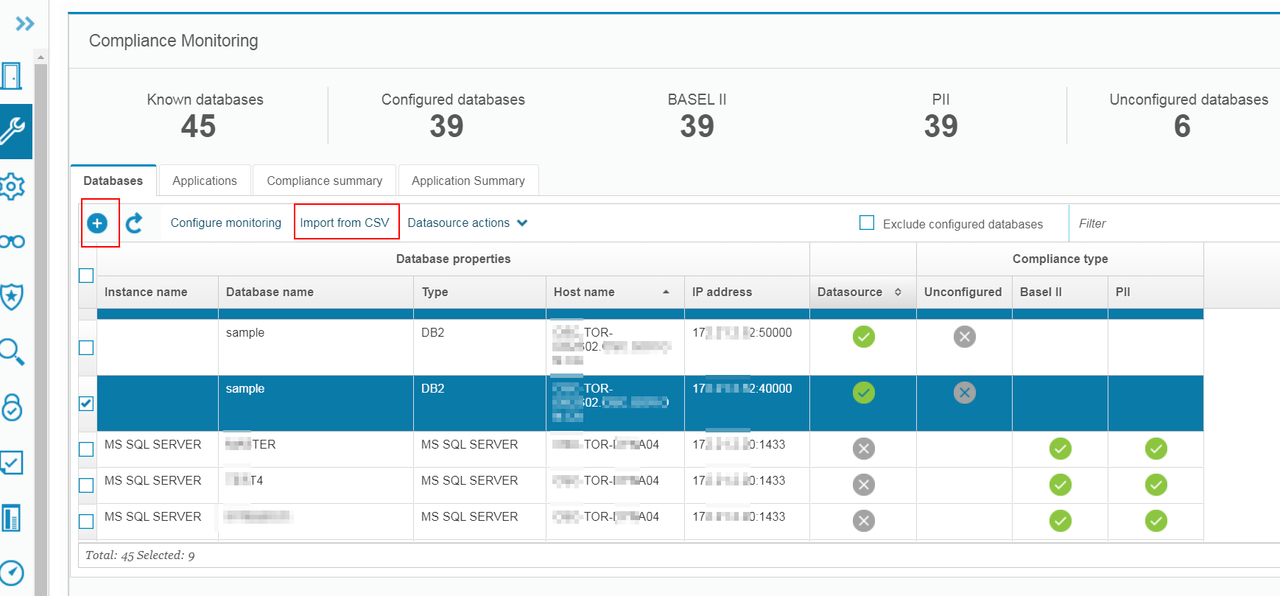
1.1 Add Database / DatasourceYou can add Database by manually adding it or import from CSV file:
DataSource (Credentials) can be added into Guardium automatically once you providing credentials during importing or manually adding.
Else you can add it later through Setup -> Datasource Definitions. Datasource will be required for certain applications such as Vulnerability Assessment or Discovery Sensitive Data.
Another way for Guardium to recognize the databases is using STAP installed on DB server automatically. Once you have STAP installed on DB servers, Guardium will monitor and analyze the traffic in/out DB servers and add Database into Guardium automatically.
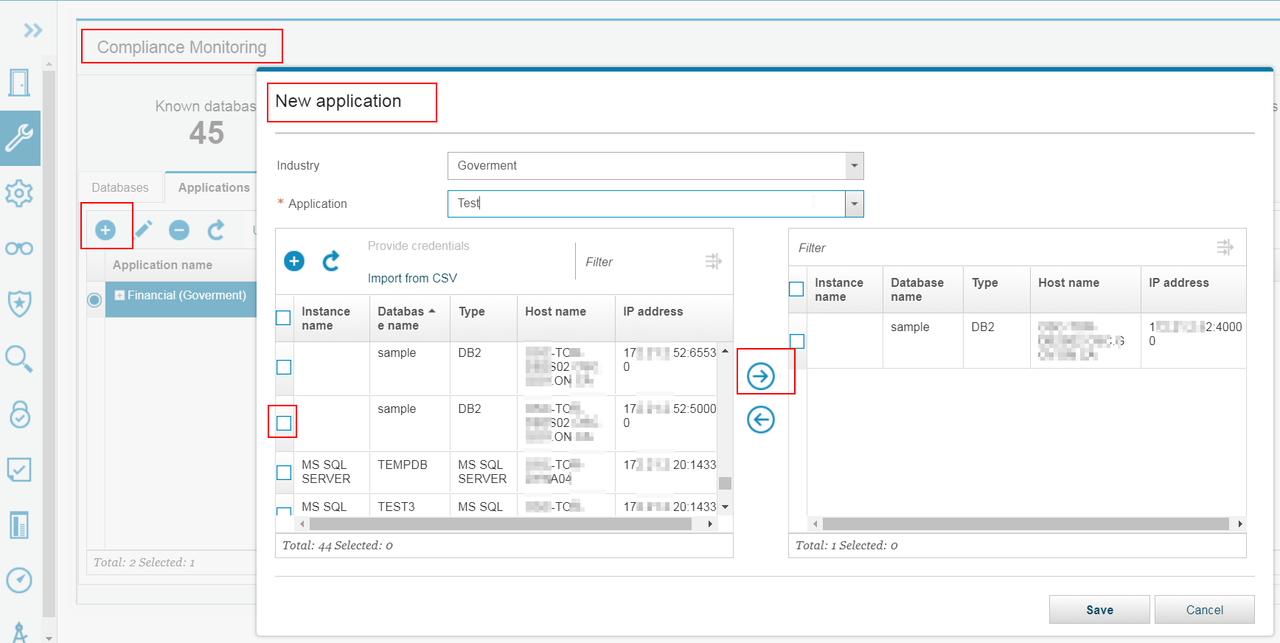
1.2 Manage Applications:
The applications tab of the compliance monitoring smart assistant provides a tree-based view of all applications and their assigned databases.
Use the applications tab to create, update, and delete applications. It is also possible to import a list of applications from CSV.
YouTube Video:
2. Discover and Classify
Discover Sensitive DataDiscovery and classification processes become important as the size of an organization grows and sensitive information like credit card numbers and personal financial data propagate to multiple locations. This often happens in the context of mergers and acquisitions or when legacy systems have outlasted their original owners. As a result, sensitive data may exist beyond the knowledge of the person who currently owns that data. This is a common yet extremely vulnerable scenario, since you cannot protect sensitive data unless you know it exists.
https://www.youtube.com/watch?time_continue=104&v=AYjjZeaeCp0&feature=emb_logo
3. Assess Vulnerabilities
Vulnerability AssessmentAssessments are a group of tests that scan database infrastructures for vulnerabilities and provide an evaluation of database and data security health with real-time and historical measurements.
https://www.youtube.com/watch?time_continue=2&v=kcqWERN-1yc&feature=emb_logo
4. Monitor Data Access
4.1 Set Up Compliance Monitoring
The compliance summary provides an at-a-glance view of compliance monitoring configuration and immediate access to related policies, groups, and reports.
Open the summary by navigating to and clicking the Compliance summary tab.
The application summary provides an immediate view of database monitoring, group population, and policies associated with an application, including key security metrics for the associated.
Open the summary by navigating to and clicking the Application summary tab.
4.3 Install Basic Security Monitoring Policy
Use the basic data security monitoring policy to get started with Guardium SQL traffic monitoring.
Guardium ships with a pre-defined policy installed by default: Default - Ignore Data Activity for Unknown Connections [template]. This default captures session-level information such as client and server IP addresses, database type, operating system user, source program, and database session start and end times, but it does not capture actual SQL activity.
Compared to the default policy, the basic data security monitoring policy allows you to starting monitoring SQL traffic right out of box. Using predefined groups of privileged users, privileged commands, and error codes for some of the most common use cases, the basic monitoring policy provides rules that address common data access and attack patterns. Although it is not a comprehensive auditing policy, the basic monitoring policy offers a secure foundation while you develop database activity monitoring policies specific to your environment and needs.
5. Advanced Analytics
Guardium's Active Threat Analytics, Risk Spotter, and Investigation Dashboard give you both a bird's eye view of potential risks in your system, risk trends over time, and tools to investigate the potential risks. Incorporate these tools into your daily Guardium routine to increase your abilities to identify and manage risks.5.1 Risk Spotter
Risk Spotter is a First of its Kind technology, changing the security paradigm to an Artificial Intelligence Data Protection Policy. It uses a smart algorithm to search within and outside your policy radar (your installed policies), and it uses a holistic algorithm to dynamically assess risk factors. Its dynamic risk assessment considers many risk factors, including: outliers, vulnerability, volume of activities, access to sensitive data, type of commands (privileges). Risk Spotter presents the risky users and risk trends across your entire system, in easy to read graphs. The Risk Spotter page contains all the configuration and results, and actions you can take.
5.2 Active Threat Analytics
Active Threat Analytics shows potential security breach cases, based on the outlier mining process and identified attack symptoms. Use its dashboard to view and investigate cases, and take actions on individual cases.
5.3 Investigation Dashboard
The Investigation Dashboard provides powerful tools for identifying and assessing problems that might exist in your Guardium environment. It uses either local or system-wide unfiltered data, and provides numerous filter options to query data across an entire Guardium environment, potentially from any Guardium collector within that environment.






This is a draft version. You might want to add more columns into this list, such as comments, description, Due Date, Resource Name, etc.
ReplyDelete