This post summarize some Guardium Administration tasks and health check steps.
- Change Password for Guardium System
- Guardium Administrator Responsibilities
- Accessmgr account unlock / reset
- Query Builder
- Troubleshooting Commands
- Health Check
- Keep Windows STAP Healthy
Change Password for Guardium System
Guardium Administrator Responsibilities
Maintaining Access
Up to date access
details are crucial for smooth running of the environment for all users.
·
Maintain
GUI admin, accessmgr and CLI account passwords. If you do not hold the
accessmgr account details you should be aware of who in your organisation does.
Responding to problems
Alerting should be used to
quickly identify and react to common problems. Chapter 3.9.8 details the following
correlation alerts to implement.
·
No Traffic
(predefined) What to do if you receive “No Traffic” alert. How to check if the correct data is being logged on my Guardium Appliance?
·
Sniffer restarts
(user created) How to alert when the number of sniffer restarts is high. For further details on how to improve sniffer performance see chapter 7.1.2
·
Disk space (user
created). How to set up disk space alert. What to do if I see my Guardium Appliance getting full?
·
If you are unsure how
to contact Guardium support, check chapter 5 and appendix A of the support handbook. When assessing the severity of your problem
see: What type of problem can I consider to be severity 1?
Monitoring performance
Monitoring
the environment on a day to day basis is required to understand the typical
behaviour. This knowledge is useful when making changes or troubleshooting
problems.
·
Configure unit utilization report to monitor inspection-core
performance in centrally managed environments. See chapter 7.1.2 - configuring the operational dashboard.
·
In Centrally managed
environments, set the Enterprise STAP view report to see status of all STAPs.
·
Enable
S-TAP statistics to monitor UNIX STAP performance. See chapter 7.1.1
Reviewing
configurations
Incorrect or
inefficient configuration is the root cause of many Guardium problems. You are
responsible for ensuring your environment is configured correctly.
·
Ensure the data
management configurations (chapter 3.9.3-5) and schedule (chapter
3.9.6) are set in a logical way. Common mistakes include:
- Filling up
appliance database due to purge settings.
-
Taking duplicate archive files.
- Purging data that
has not yet been archived or exported.
- Scheduling data
management processes to overlap.
·
Do not schedule audit
process jobs to overlap with aggregation jobs, other audit processes jobs or
run before 1:00 am.
·
Ensure audit process
results are purged correctly. How do I purge off old audit results from Guardium? Check and sign off
audit process receiver to-do lists.
·
Periodically review
your policy against business requirements, especially if new STAPs are added.
Use chapter 5.2 and 5.4 to help with policy definition.
·
Periodically review
report definitions and results against business requirements. Reports should be
targeted to contain only relevant information for the receivers. For
information on defining queries and reports see chapter 5.2 and 5.5.
·
Periodically review
correlation alert definitions. If you are getting many alerts but taking no
action you need to review the alerting strategy. Disable alerts you do not plan
to use.
Keeping informed
Guardium regularly
releases alerts, fixes, documentation and tech talks. Keeping informed ensures
your knowledge is up to date and you do not miss important fixes.
·
The latest appliance
patches and agents are available on fix central. Install the latest packages to eliminate known problems.
Note: https://www.ibm.com/support/pages/ibm-security-guardium-administrator-responsibilities-guide
Accessmgr account unlock / reset
Log in to the CLI and run the following command: support reset-password accessmgr<N>|random.
You can use <N> or random where <N> is a number in the range of 10000000 - 99999999. Random automatically generates a number in the range of 10000000 - 99999999. Open a PMR with IBM Guardium support and send the following output.
G10.ibm.com> support reset-password accessmgr random
Password for accessmgr account have been successfully reset using keyword:<passkey>
Please provide these number to Guardium Customer Service to receive actual account password.
ok
After you receive the new password, unlock the account.
- Use the following command to unlock the account. unlock accessmgr.
- Log in as accessmgr and edit the accessmgr details to enter a temporary password.
- Log in again with the temporary password.
- When you are prompted, enter a new password.
Unlock
login as: cli
Pre-authentication banner message from server:
IBM Guardium, Command Line Interface (CLI)
End of banner message from server
[email protected]'s password:
Last login: Fri Nov  1 01:30:01 2019
Welcome cli - your last login was Wed Sep 11 01:30:03 2019
Your password has expired.
Changing password for 'cli'.
Enter current password:
Enter new password:
Re-enter new password:
51sec-igcm01.itprosec.org> unlock accessmgr
ok
51sec-igcm01.itprosec.org>
Query Builder
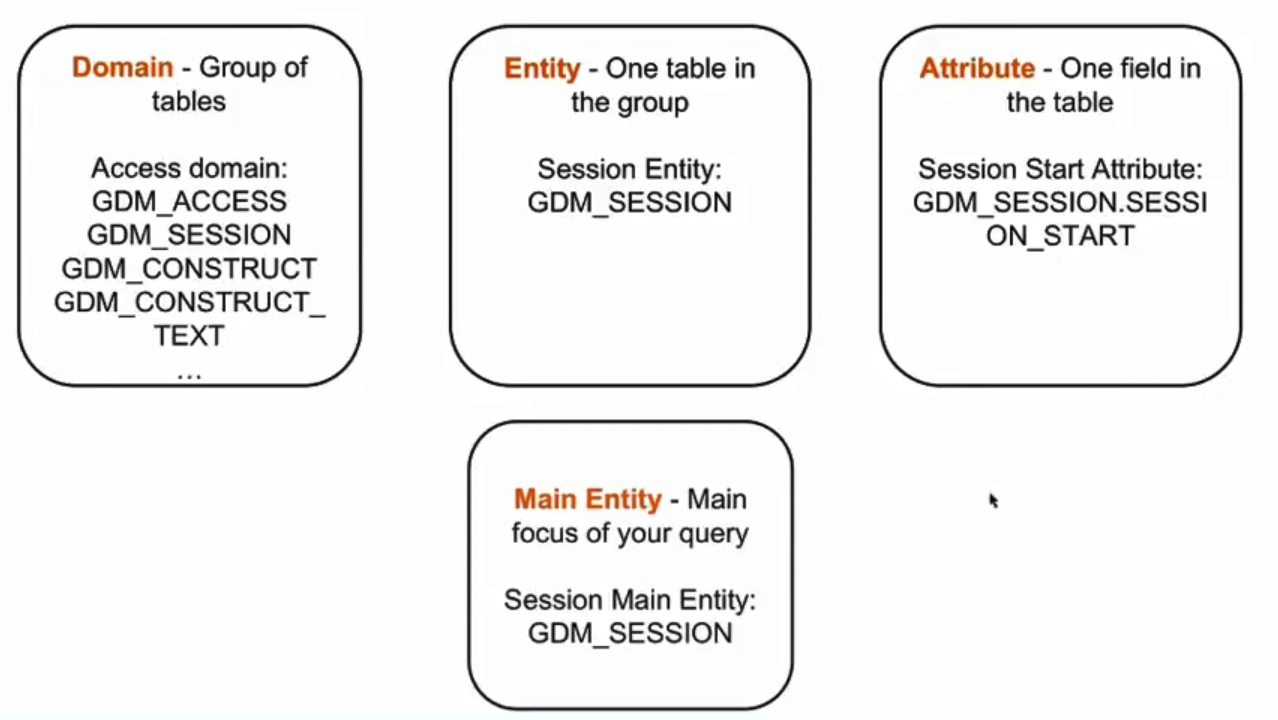
Key Concepts:- Domain - a set of tables that is linked based on the purpose or function of the information in those tables
- Access Domain - Tables related to access of data on a monitored database
- Policy Violation domain - Tables related to policy violation events as defined by the policy
- Aggregation/Archive Domain - Tables related to aggregation processes running on the appliance
- Entity - a label for one table within a domain
- Attributes - one field within an entity
- Main Entity - the entity that is the focus of the query. That will be one row in the report for each row in the table corresponding to the main entity.
Tips for creating a useful Query:
- "Access Rule Description" attribute
- Fill SQL Entity -> Access Rule Description
- Policy violations Domain -> Policy Rule Violation Entity -> Access Rule Description
- "Session Ignored" attribute
- Session Entity -> Session Ignored
- Export to CSV and filter from there
- useful with many results
- Predefined queries
- Search in the main entity for predefined queries
- Clone existing queries
Troubleshooting Commands
itprosec-tor-igcm01.51sec.org> support show db-top-tables all
 Table Size (M) | I/D % |  Unused(M) | Est. Rows | Name
 -------------- | ----- |  --------- | --------- | ----------
          17431 |     5 |          0 |  28875494 | MESSAGE_TEXT
          10399 |    22 |          0 |  28875459 | GDM_POLICY_VIOLATIONS_LOG
           9520 |    32 |          0 |  34402643 | GDM_CONSTRUCT_TEXT
           4169 |    56 |          0 |  28875476 | MESSAGE
            682 |    87 |         65 |   2523707 | GDM_FIELD
            564 |   140 |          0 |   2284882 | GDM_CONSTRUCT_INSTANCE
            248 |    57 |          0 |    678447 | GDM_SESSION
            166 |   162 |          9 |    495964 | GDM_OBJECT
            145 |    40 |          0 |    512957 | GDM_EXCEPTION
            125 |    17 |         18 |    231925 | GDM_CONSTRUCT
            114 |    59 |         12 |    648703 | GDM_SENTENCE
             55 |    48 |          0 |    491064 | GDM_APP_EVENT
             34 |     0 |          6 |      1825 | TEST_RESULT
             24 |   116 |          0 |    187677 | MASTER_GROUP_MEMBERS
             19 |     0 |          0 |    104519 | DB_MAINT_LOG
             16 |    70 |          0 |    179925 | MEMBERS_REFERENCE
             14 |     6 |          4 |     11984 | REPORT_RESULT_DATA_ROW
              9 |    19 |          0 |     65494 | DB_ERROR_TEXT
              9 |    63 |          2 |     78140 | GROUP_MEMBER
              7 |     0 |          4 |     20288 | SNIFFER_BUFFER_USAGE

 No tables with more than 80% of free space used found.
ok
igcm01.51sec.org> stop system
Are you sure you want to stop the system (y/n)?
Stopping system
com db-stat
com db-top
com restart
com free
to restart inspect engine: restart inspection-core
Health Check
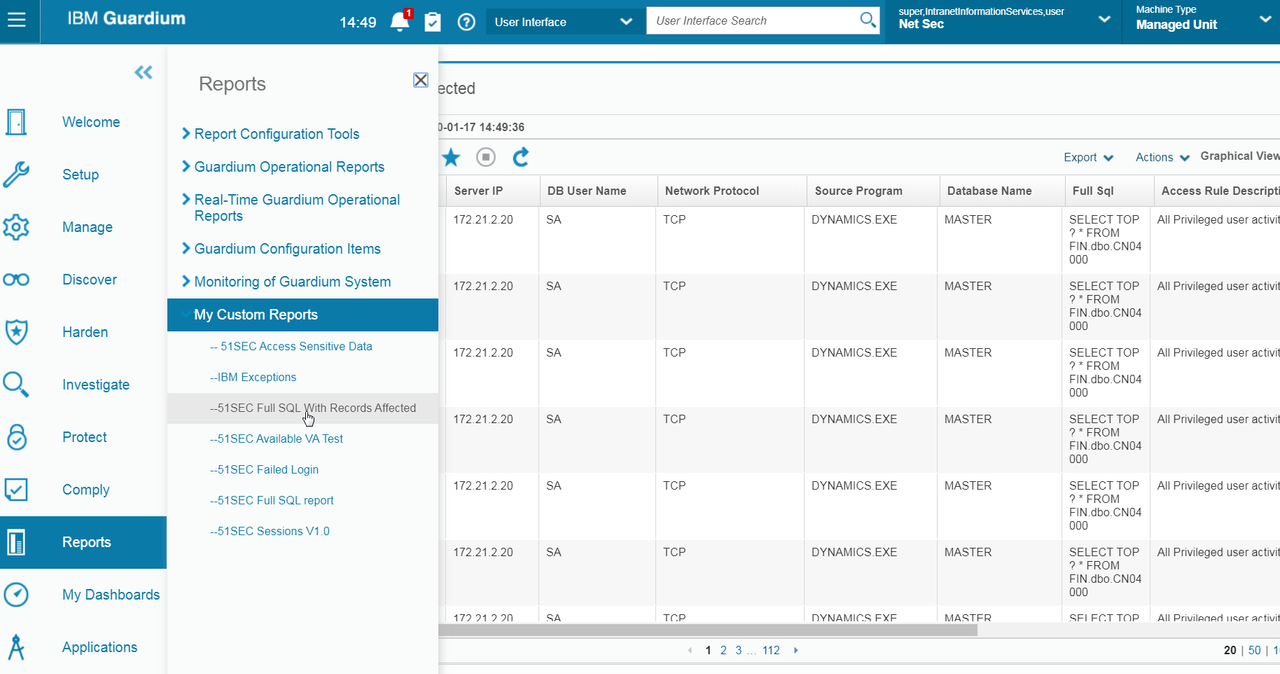
Check the Activity Report in custom report to make sure there are recent db activities. (Collector)Check Deployment Health Table (Aggregator)
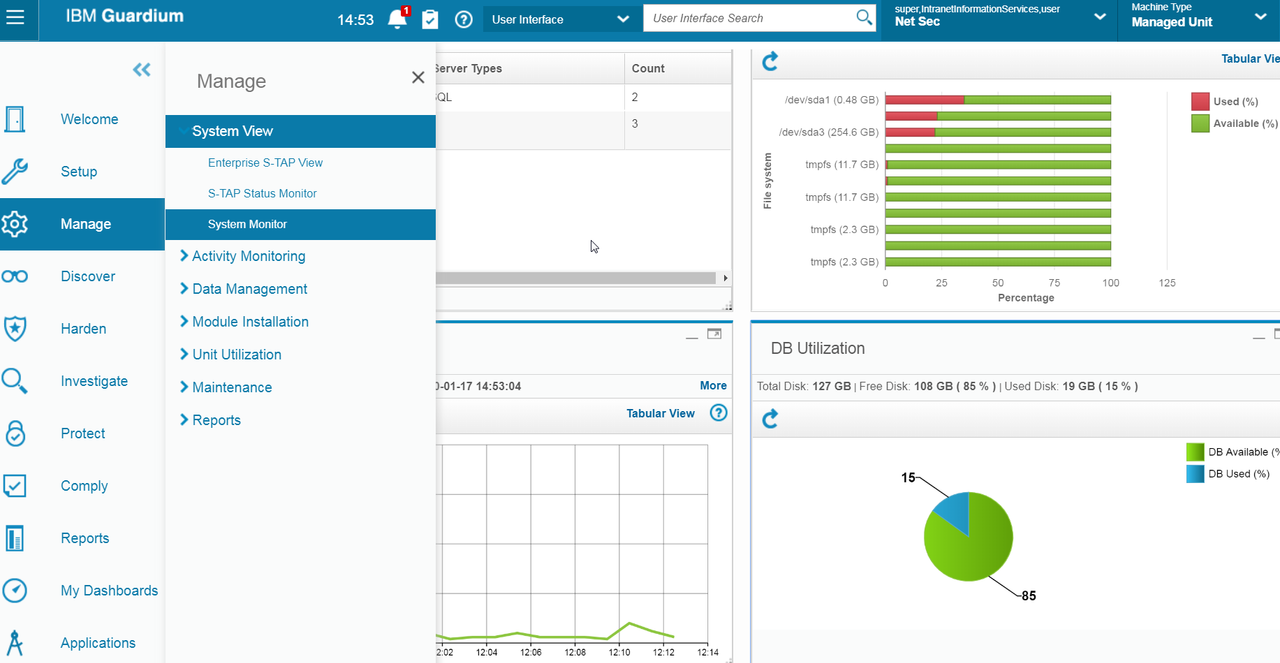
Check IBM Guardium Appliance DB Utilization / Hard Drive Space. (Both Collector and Aggregator)
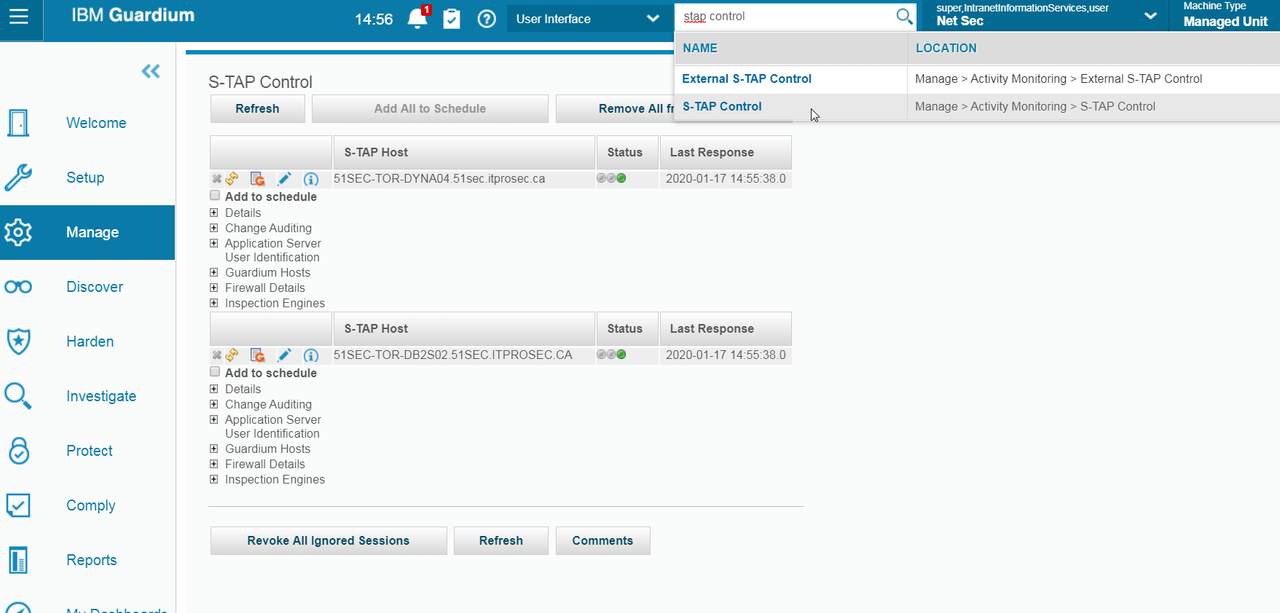
Check STAP Status (Collector)
Check GIM Status - GIM Processes Monitor (Aggregator)
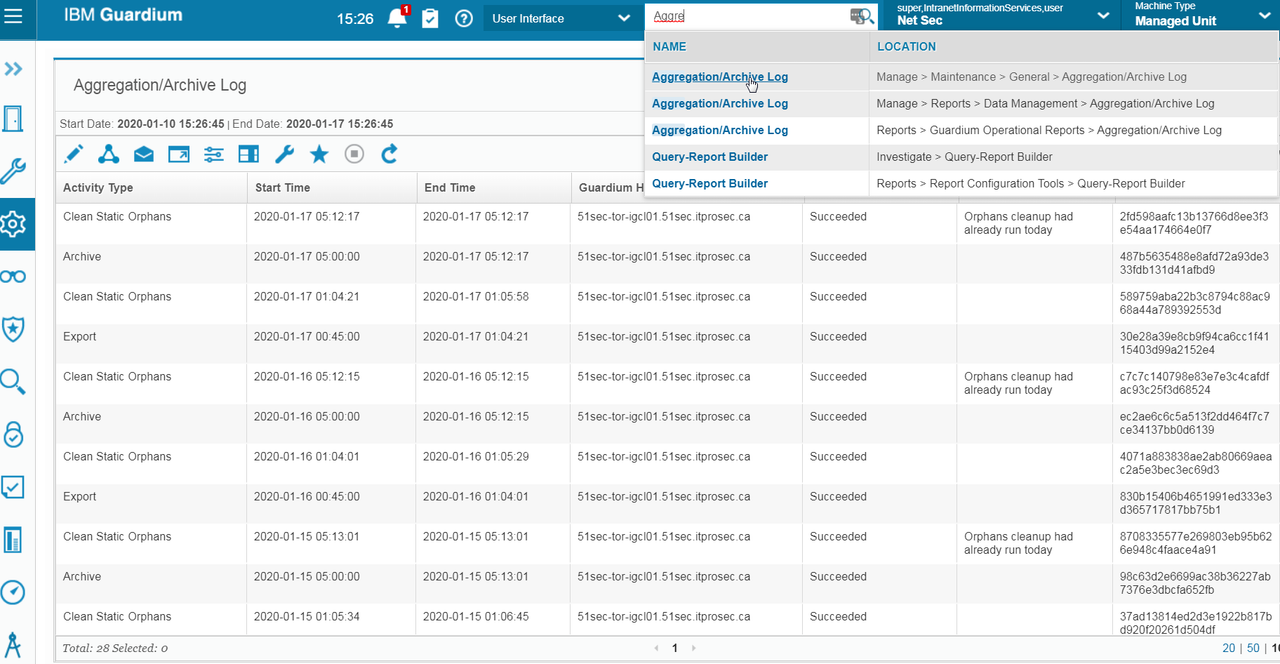
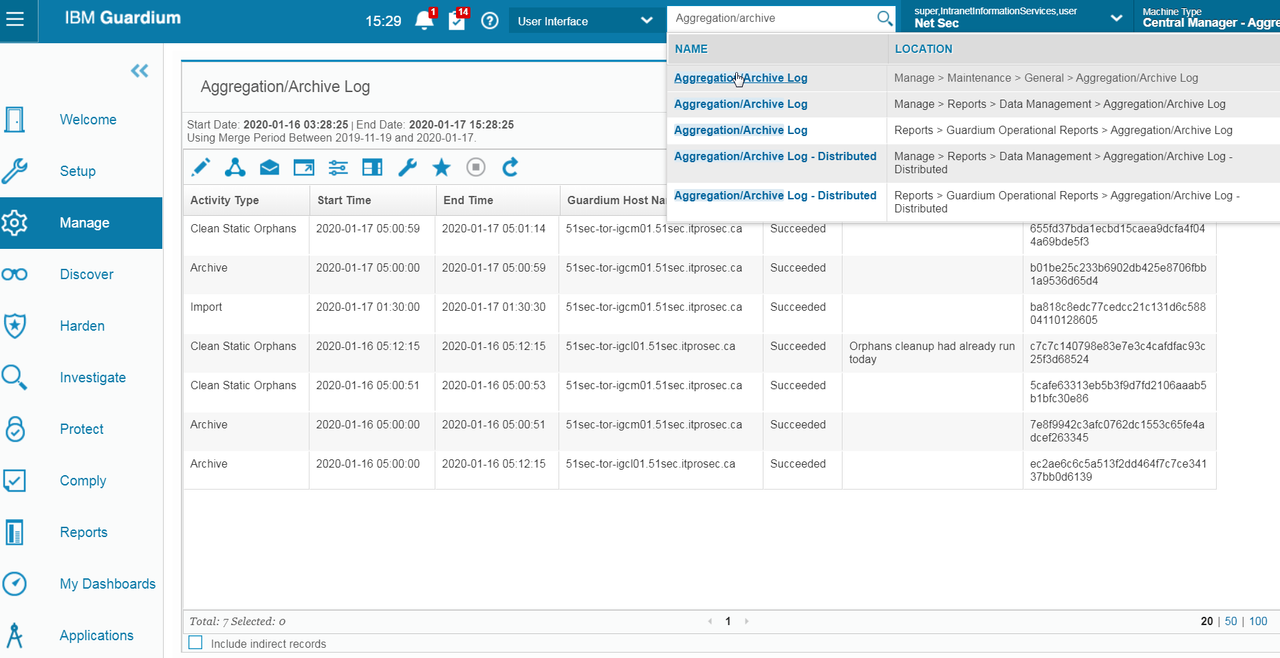
Check Archive Status from Logs
on Collector:
On Aggregator:
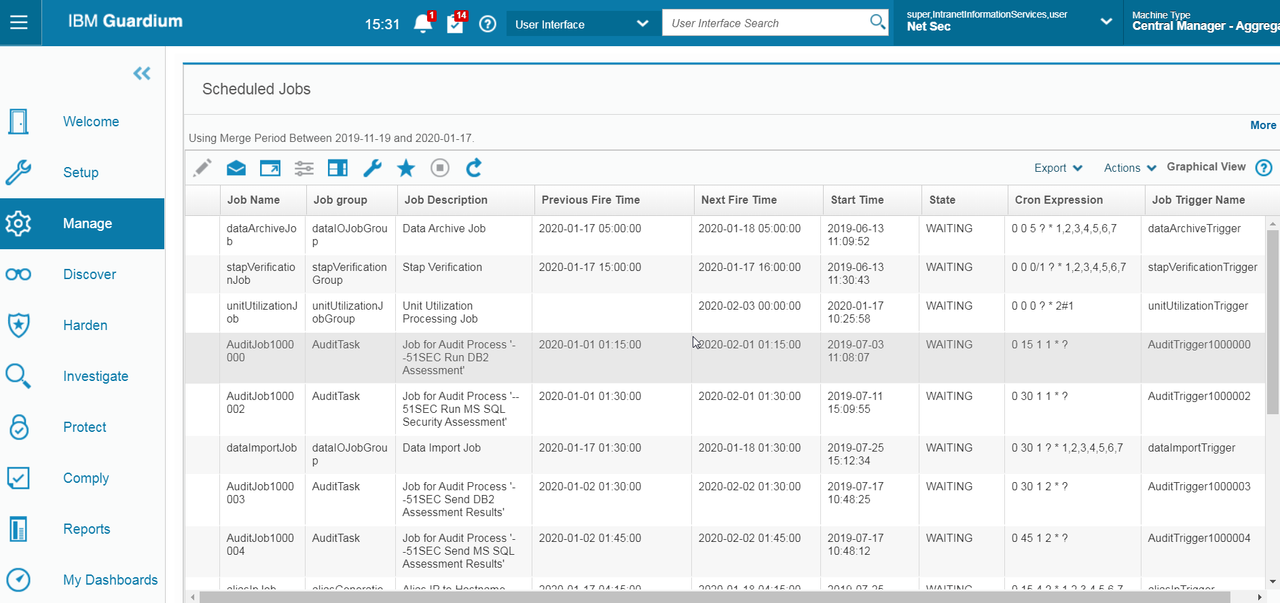
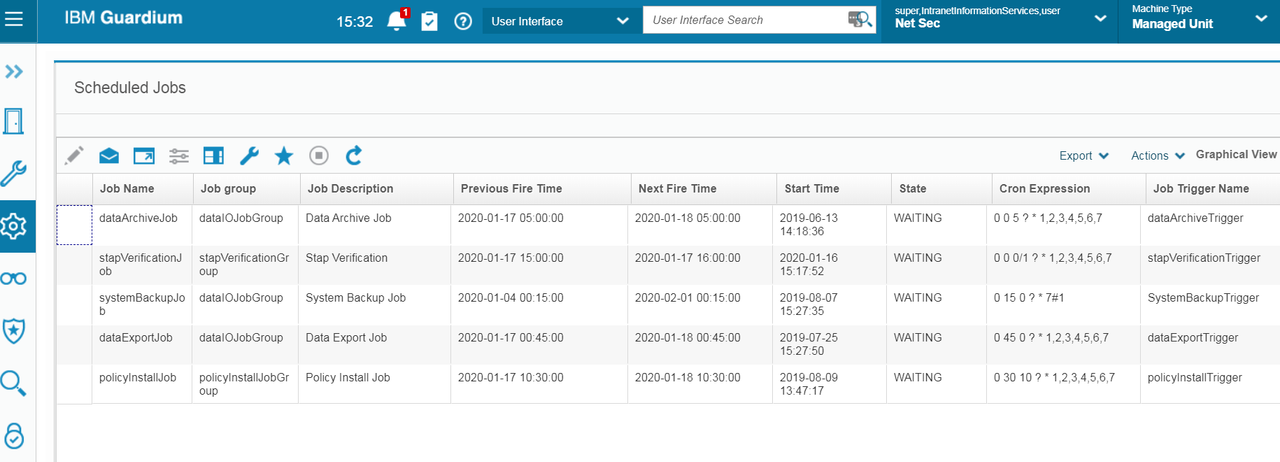
Check Scheduled Jobs:
On Aggregator;
On Collector:
Check Buff Usage Monitor
Pay attention to Flat log requests. It should be steady number. It can cleaned by restart inspection-core which is inspect engine.
Keep Windows STAP Healthy
- Make sure port 9501 is opened between Collector and DB server, then turning on USE_TLS=1
- Use DB2_EXIT_DRIVER_INSTALLED=1 to get STAP to capture all the DB2 traffic directly from DB2 engine. On Windows, your parameter WFP_DRIVER_INSTALLED should be set to 0.
- SOFTWARE_TAP_HOST or TAP_IP should always be the physical ip of the NIC card - not VIP.











No comments:
Post a Comment