 |
| Azure Monitor |
This post is to summarzie the steps to create a basic alert to monitor the traffic upload/download to/from your Azure storage account.
Azure Monitor Overview
The following diagram gives a high-level view of Azure Monitor.
- The stores for the data platform are at the center of the diagram. Azure Monitor stores these fundamental types of data: metrics, logs, traces, and changes.
- The sources of monitoring data that populate these data stores are on the left.
- The different functions that Azure Monitor performs with this collected data are on the right. This includes such actions as analysis, alerting.
- At the bottom is a layer of integration pieces. These are actually integrated throughout other parts of the diagram, but that is too complex to show visually.

Azre Monitor Cost
Estimate Azure Monitor usage and costs
If you're new to Azure Monitor, use the Azure Monitor pricing calculator to estimate your costs. In the Search box, enter Azure Monitor, and then select the Azure Monitor tile. The pricing calculator helps you estimate your likely costs based on your expected utilization.
The bulk of your costs typically come from data ingestion and retention for your Log Analytics workspaces and Application Insights resources. It's difficult to give accurate estimates for data volumes that you can expect because they'll vary significantly based on your configuration.
A common strategy is to enable monitoring for a small group of resources and use the observed data volumes with the calculator to determine your costs for a full environment.
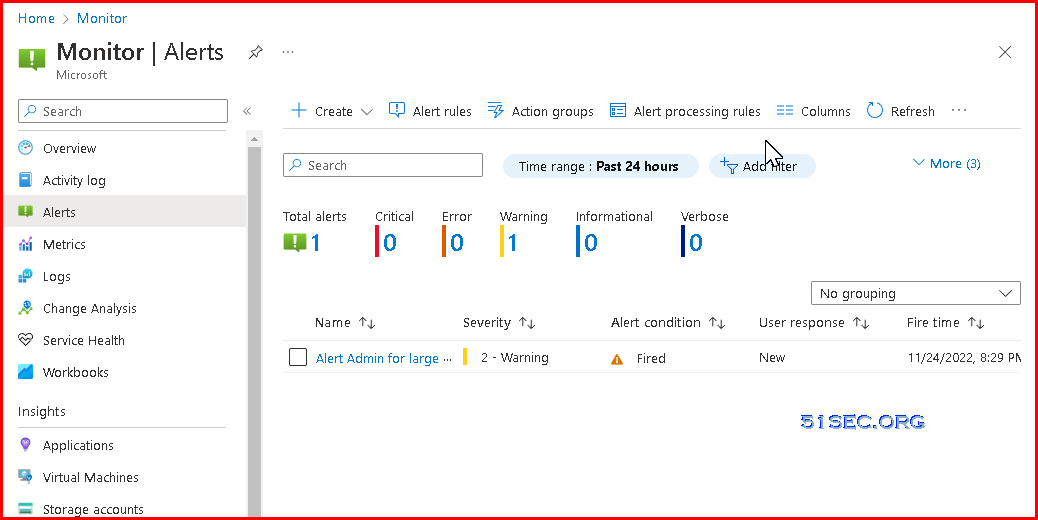
Alerts in Azure Monitor
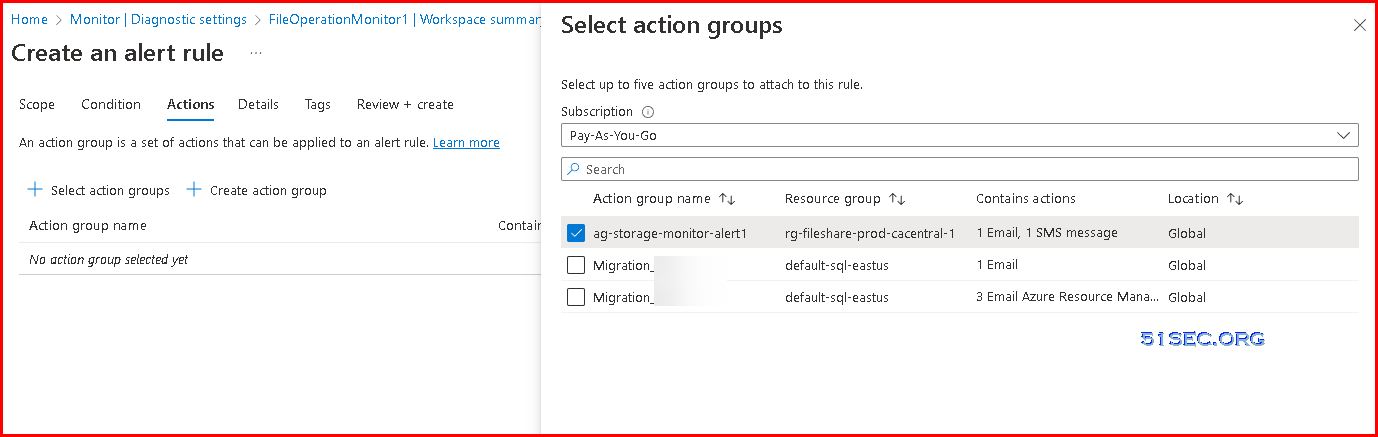
Alert rules in Azure Monitor use action groups, which contain unique sets of recipients and actions that can be shared across multiple rules. Based on your requirements, action groups can perform such actions as using webhooks to have alerts start external actions or to integrate with your IT service management tools.
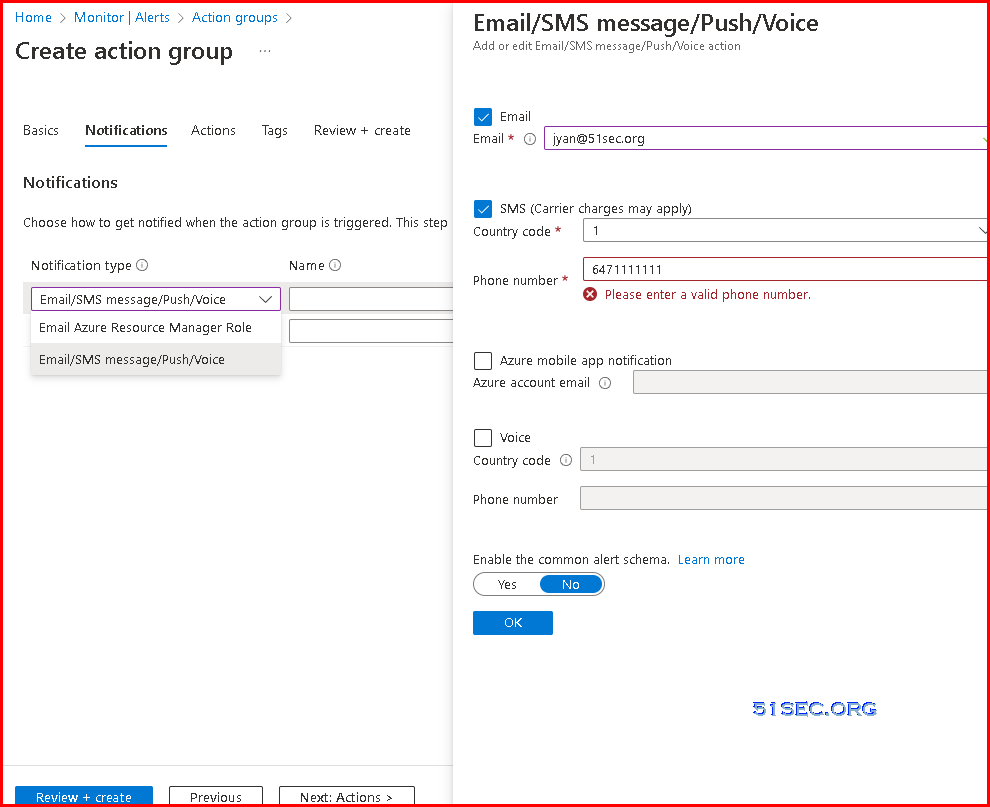
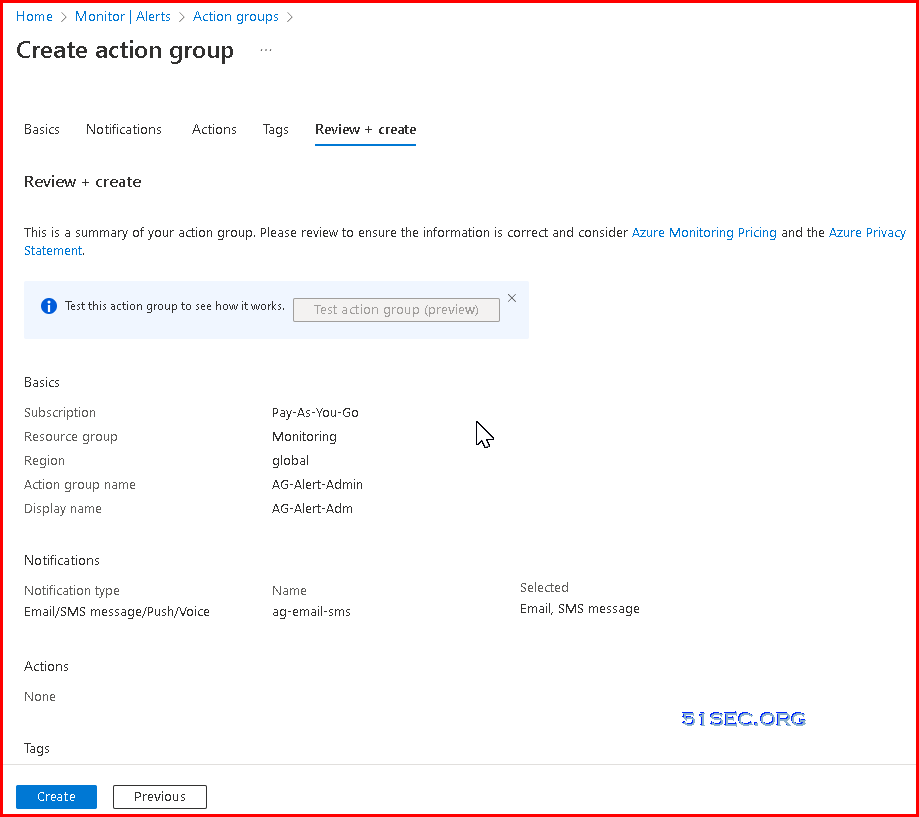
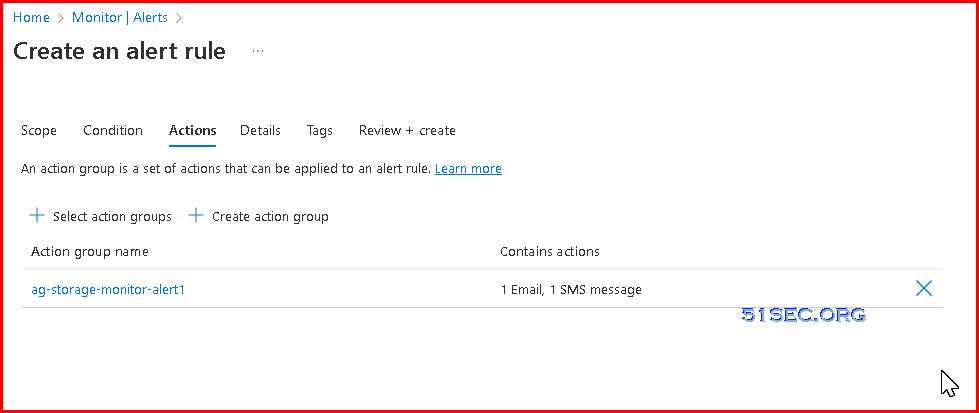
Create An Action Group

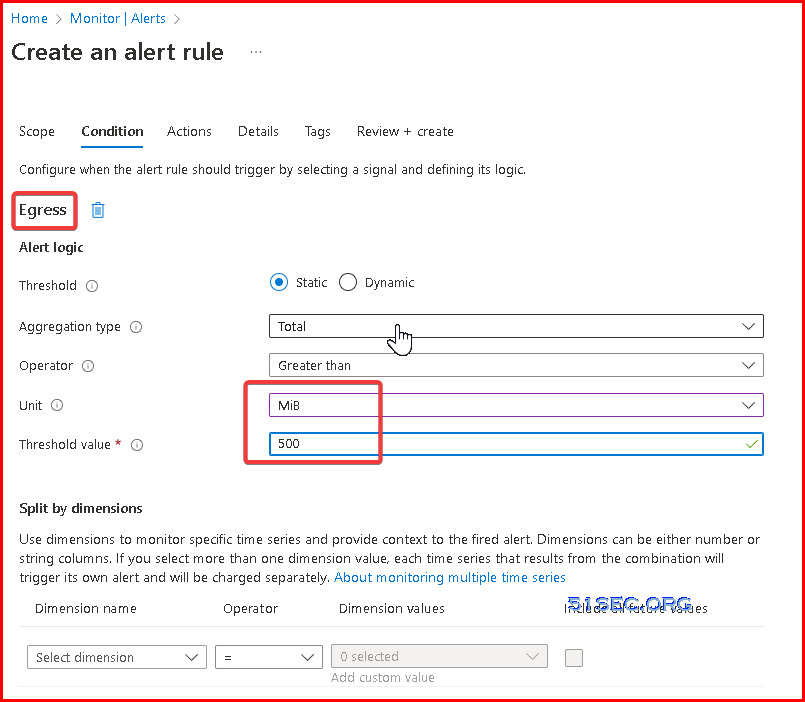
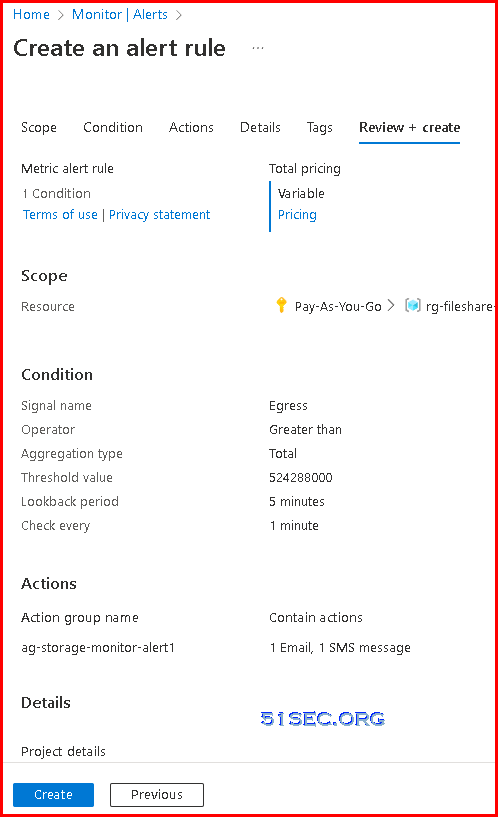
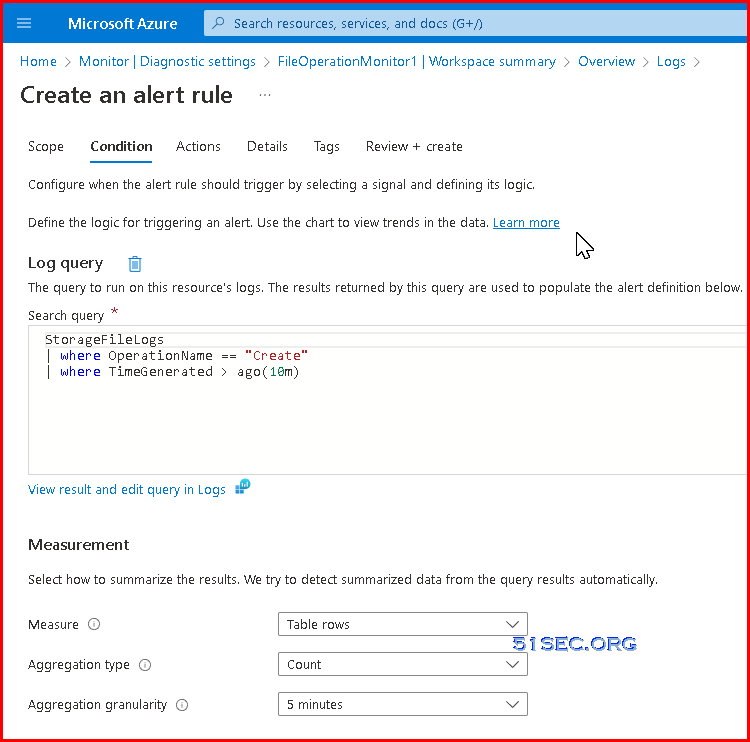
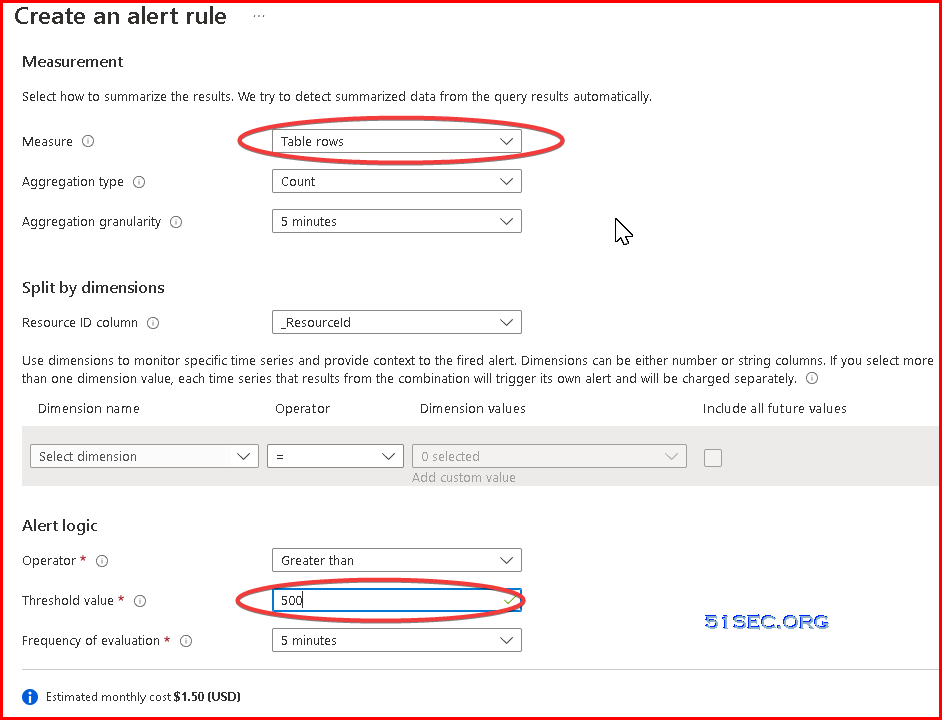
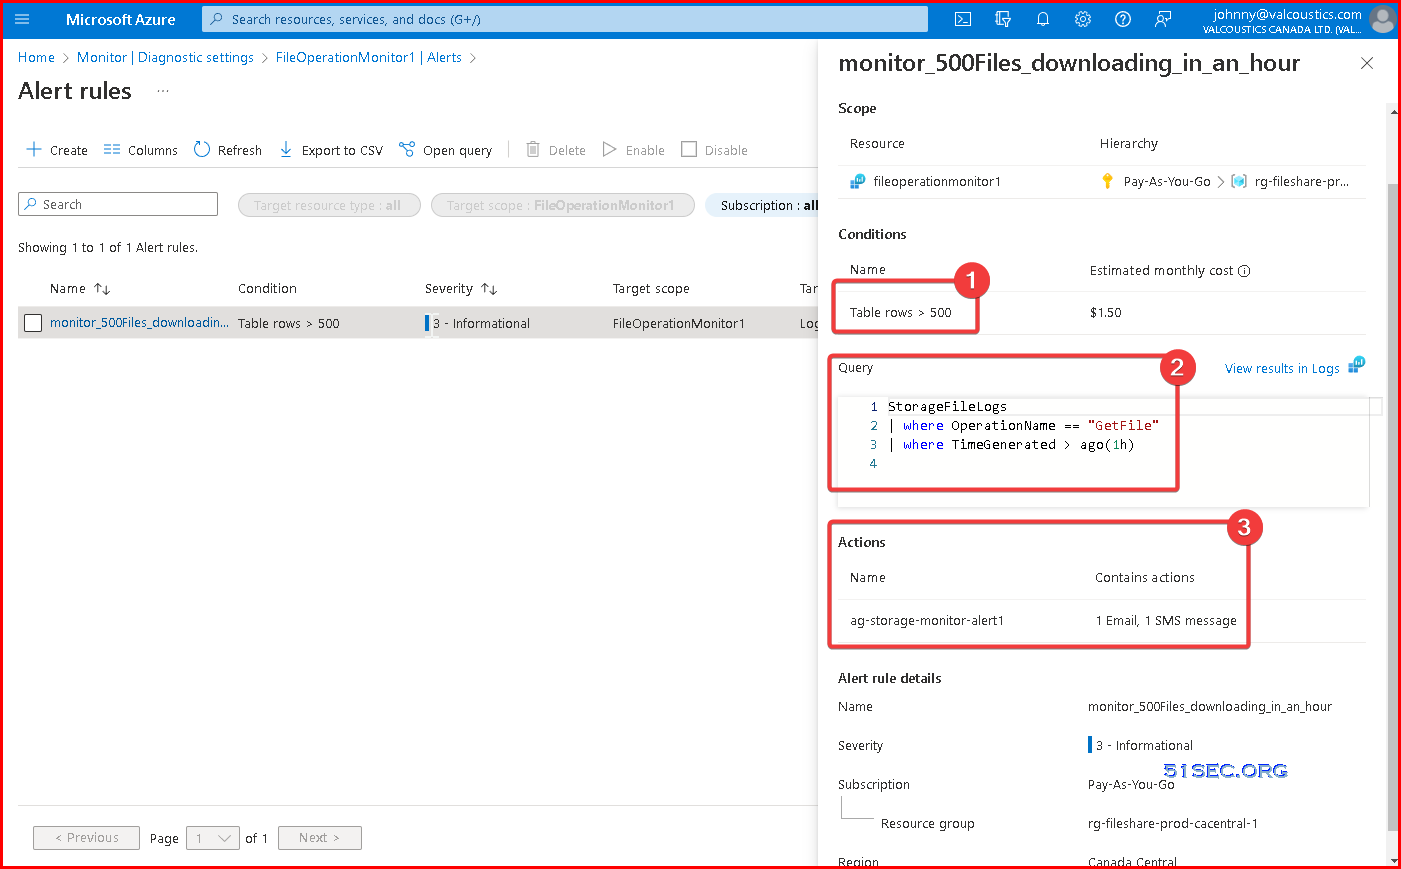
Create Alert Rule

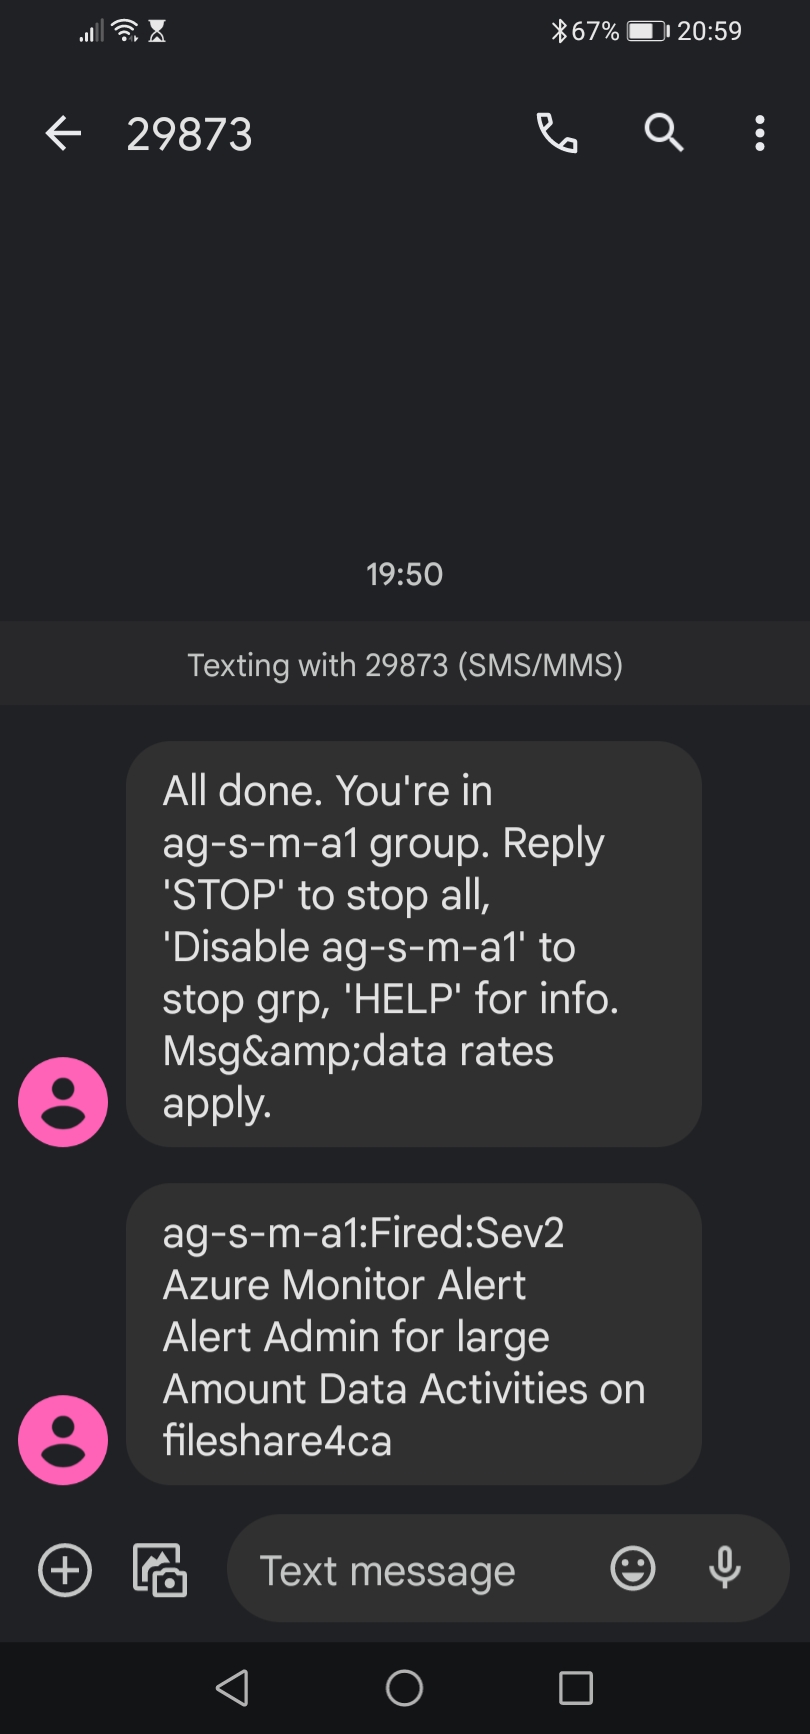
Results
Received an email when configured Azure Monitor alert was triggered.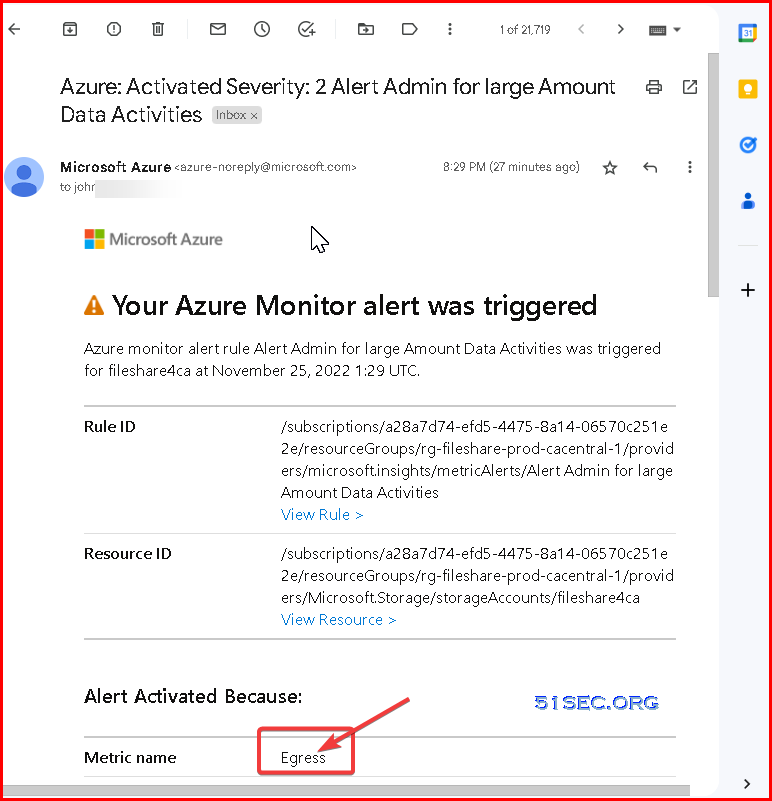
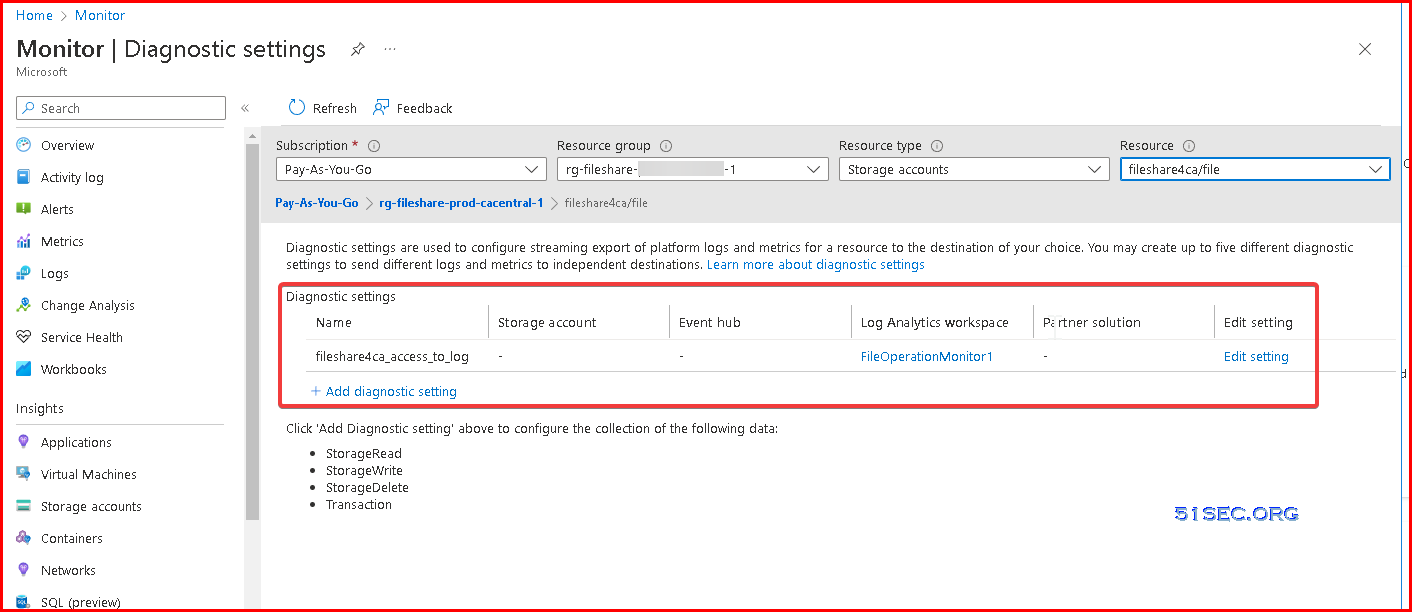
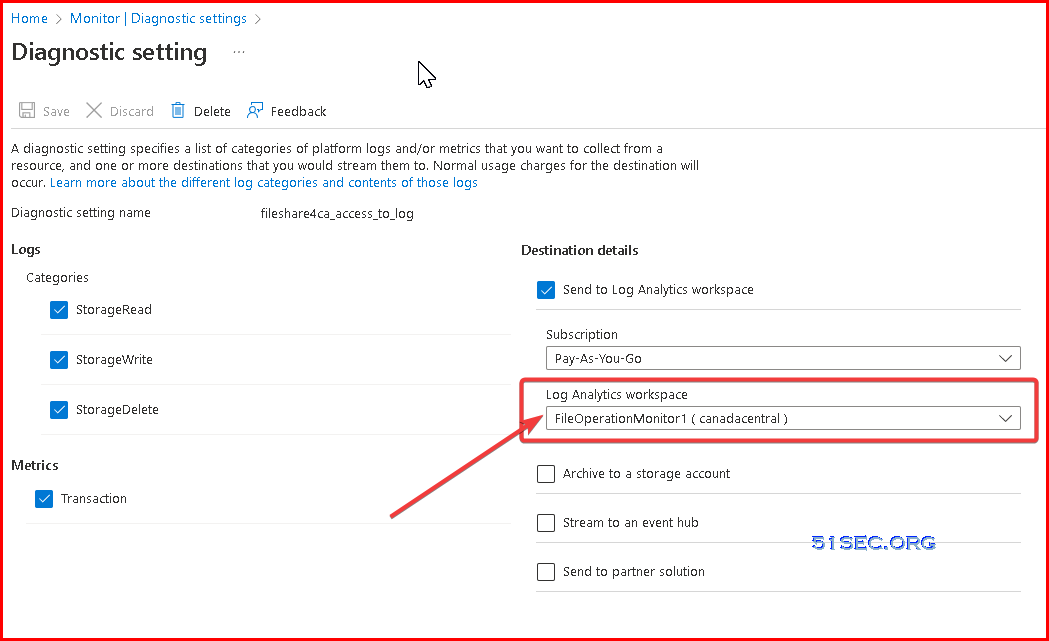
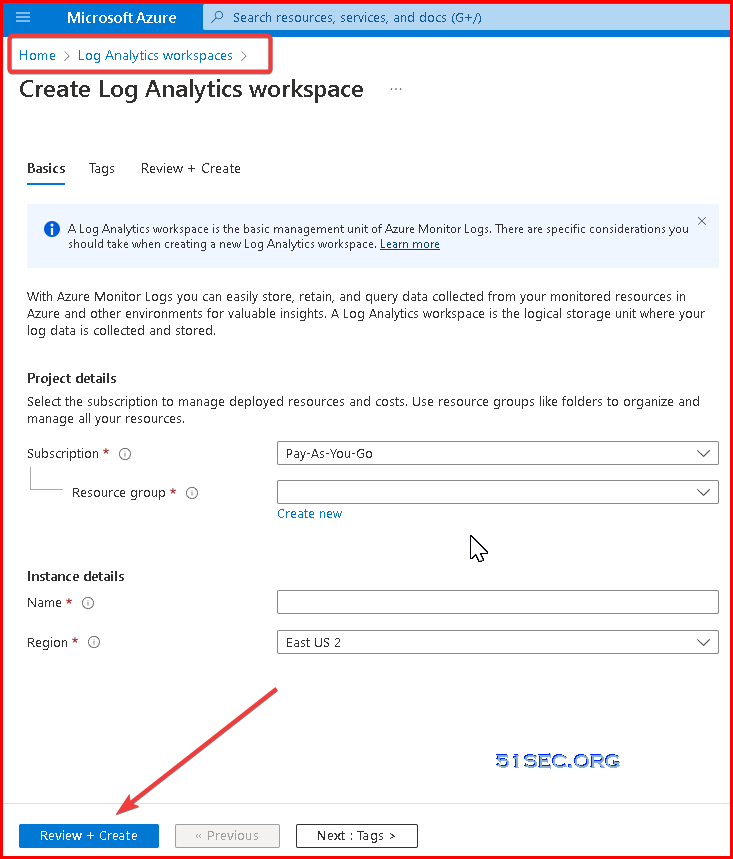
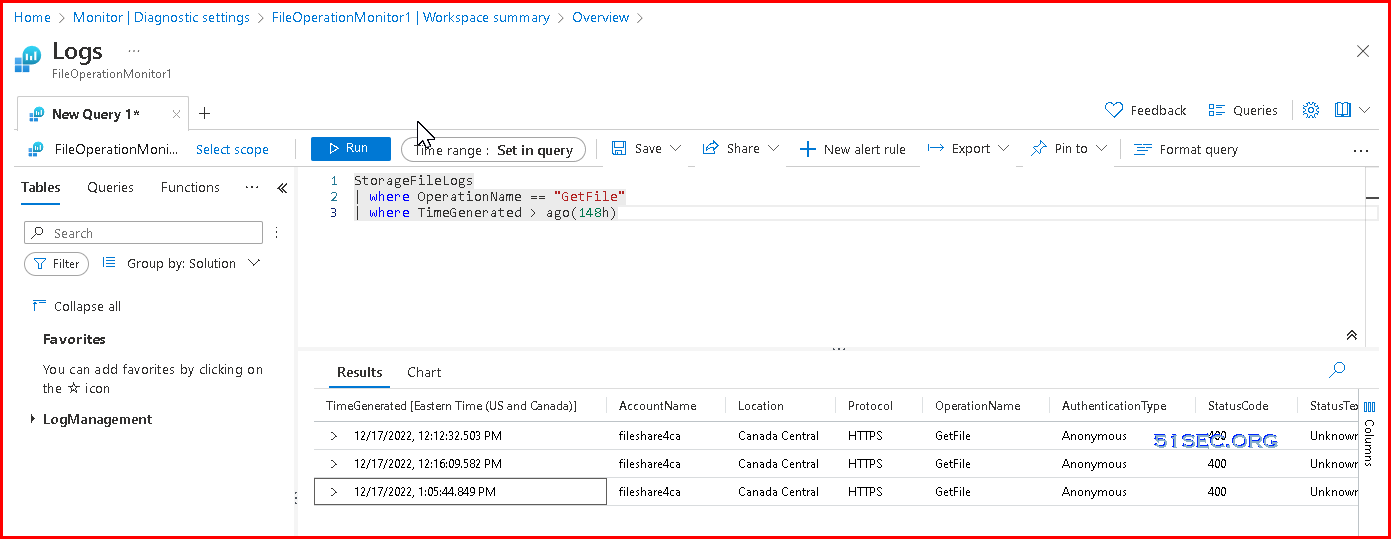
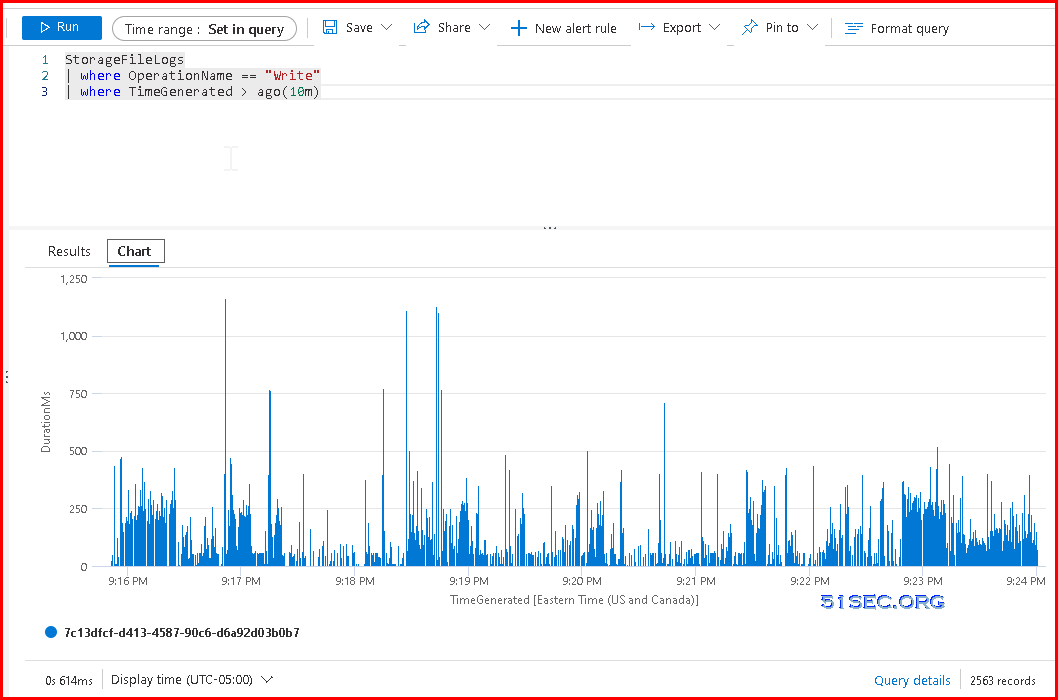
Using Diagnostic Settings to Monitor Files Access
StorageFileLogs
| where OperationName == "GetFile"
| where TimeGenerated > ago(1h)


No comments:
Post a Comment