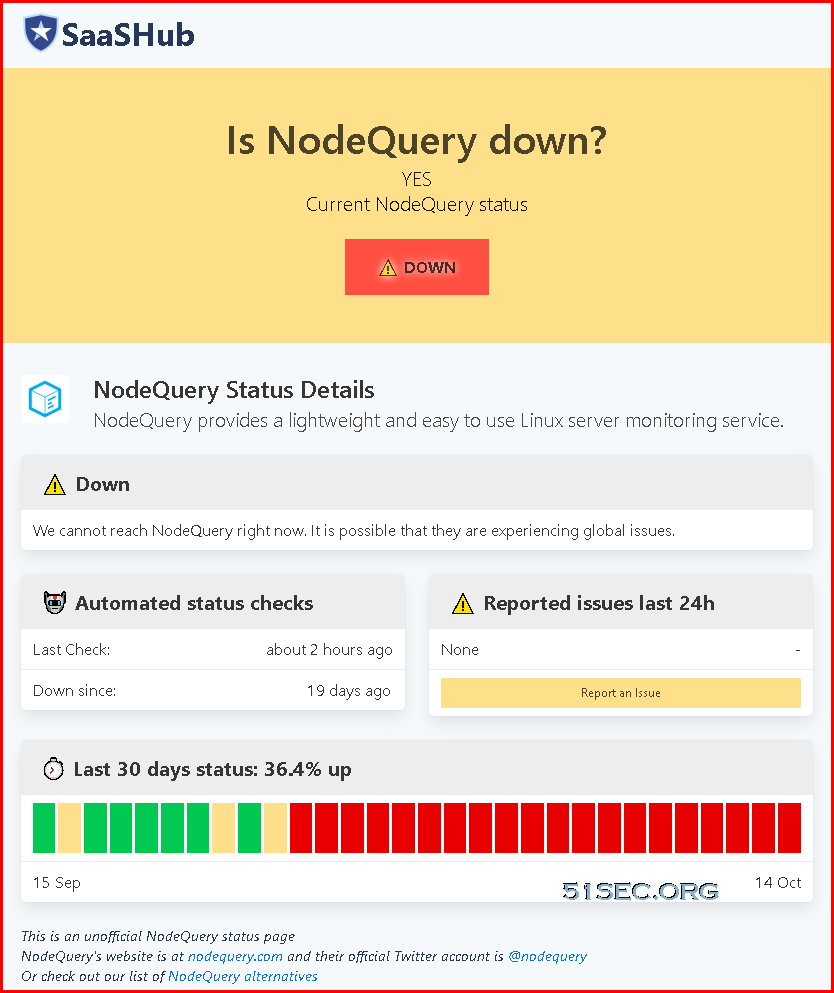
NodeQuery is a free monitoring service provider which provides a free, lightweight and easy to use linux server monitoring service. You also will get alerts and actively monitor the performance of your servers. Unfortunately, their website is not accessible since end of Sep (Sep 25, 2021)
In this post, I am going to introduce other online free monitoring service providers as alteratives.
Free Plans
To sign up a free plan, all of those four sites are no credit card required. All of them are having paid plan which provides advanced features and longer data retention period.|
|
NetData |
New Relic |
Datadog |
Instrumental |
|
Free Plan |
Unlimited
nodes Unlimited
Containers Unlimited Metrics 1s metrics
granularity Unlimited data
retention (Data is inside your infrastructure) Unlimited users Unlimited
alarms and notifications 200+ Data
collection integration |
Free forever 1 free full
user Unlimited
free base users 100GB free
per month data for ingest 8 days+ data
retention Unlimited
querying 100 Synthetics
checks Unlimited
free alerts Free proactive
anomaly detection 1K free
incident intelligence events per month |
Up to 5 hosts 1 day metric
retention 450+
integrations Unlimited
user accounts |
Up to 500
metrics 13 Months of
data visibility |
|
Installing
Agent |
-
One command installer -
Docker |
Guided install: One command installer, Docker, configuration management tools |
One command installer Docker |
|
|
Limitation |
No advanced
user control and auditing Data and calculation is on local infrastructure. Heavy agent |
|
No alerts No Container
monitoring No anomaly
detection |
No support
for Arm architecture. |
|
Pricing |
https://www.netdata.cloud/pricing/ |
https://newrelic.com/pricing |
https://www.datadoghq.com/pricing/ |
https://instrumentalapp.com/pricing |
There is one more which is also providing free monitoring to the servers, free forever, 15 Uptime monitors, 1 minute internval, which is great for a small environment.
- HetrixTools - A Free & Powerful with Full Function Website and Server Performance Cloud Monitor Site
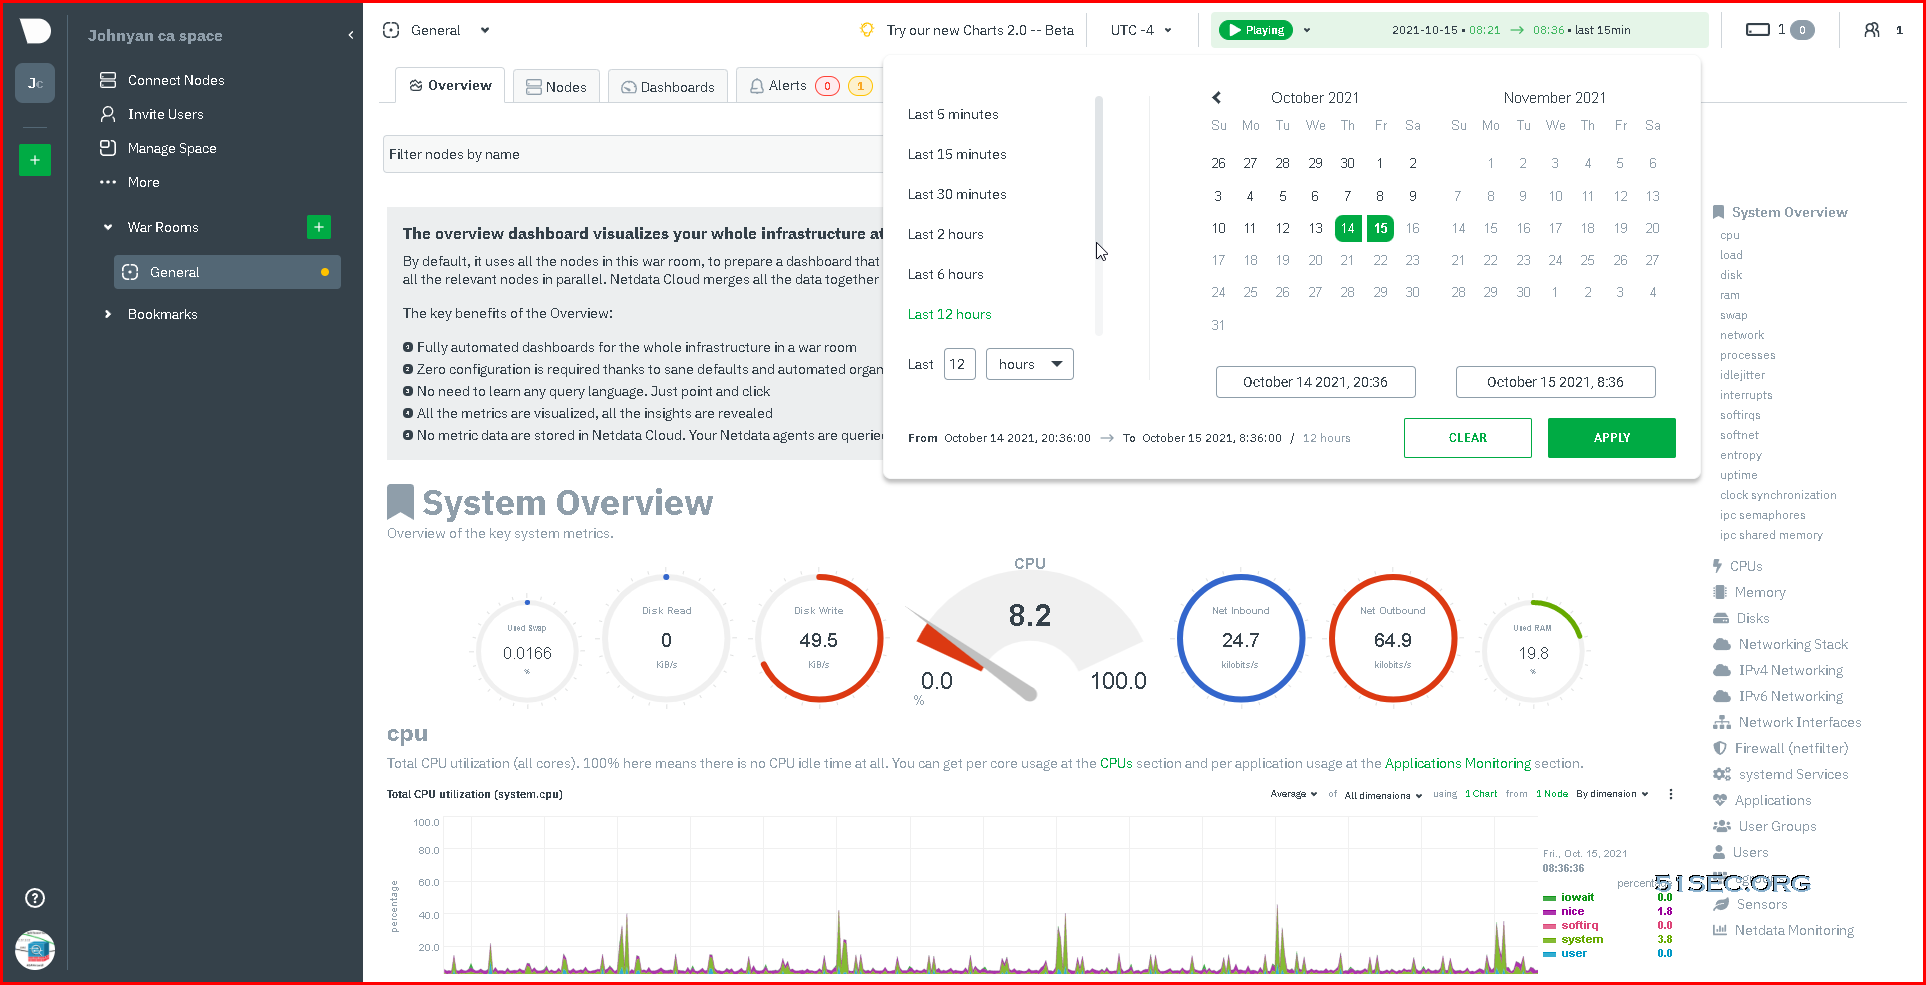
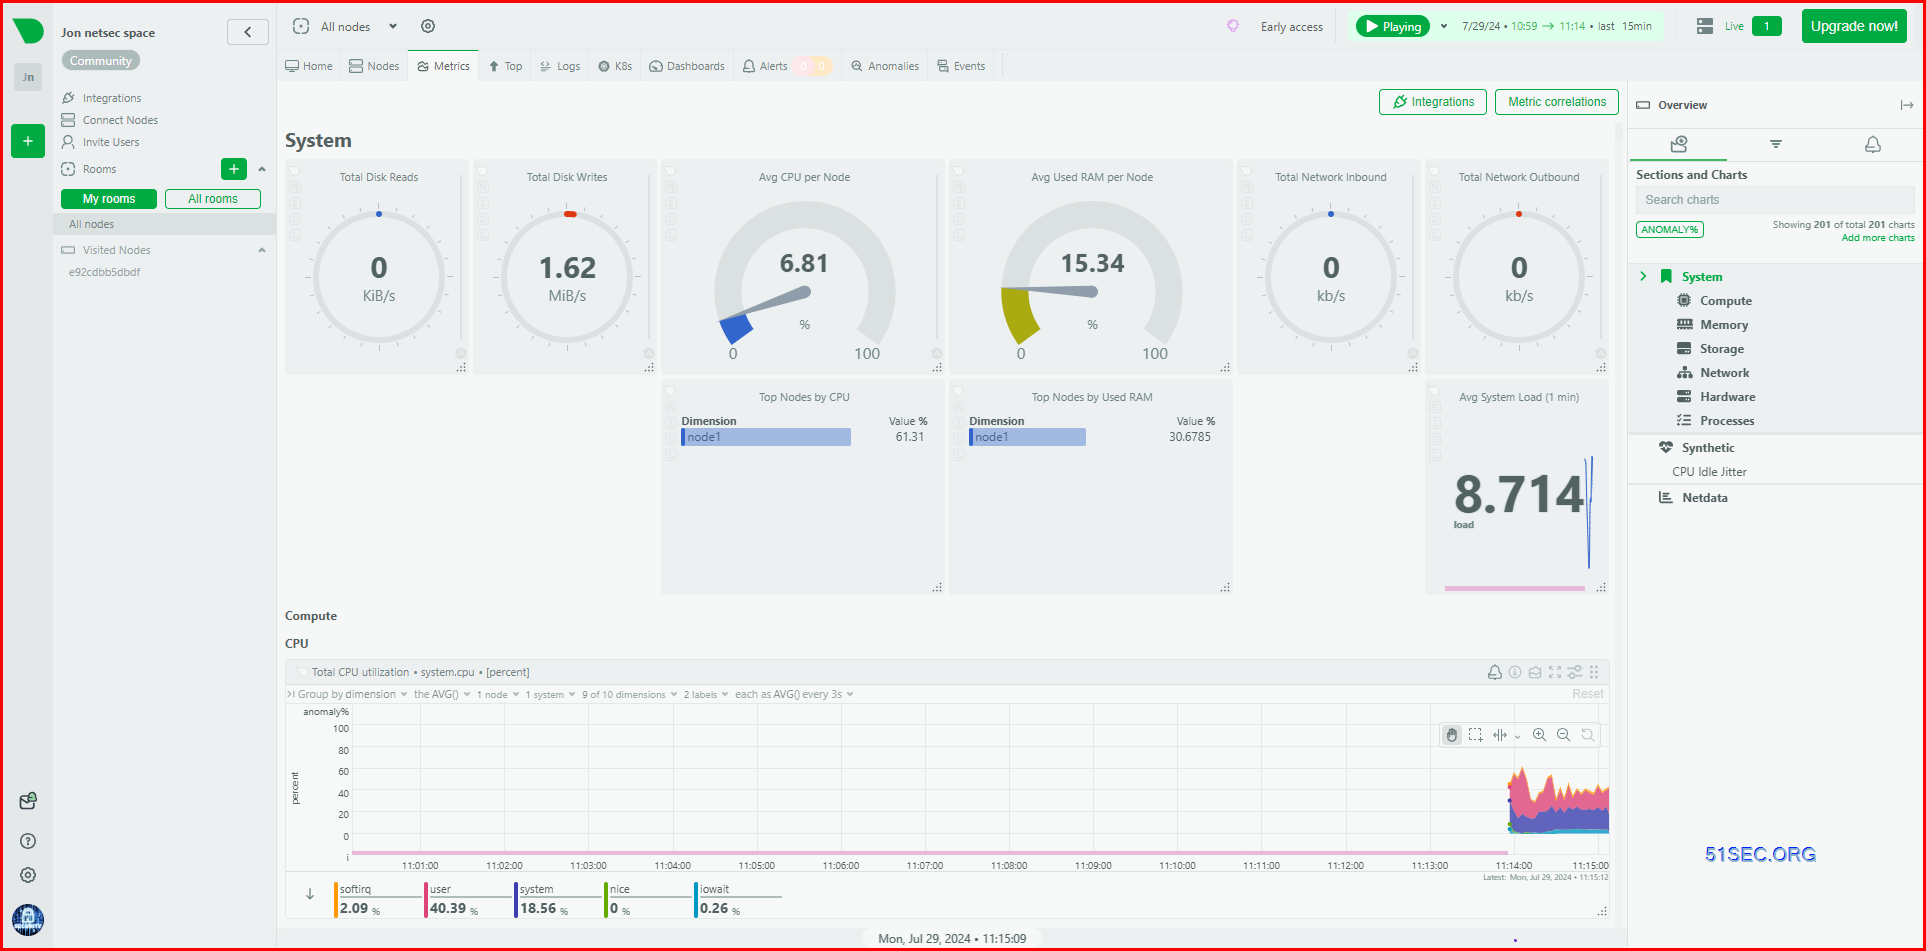
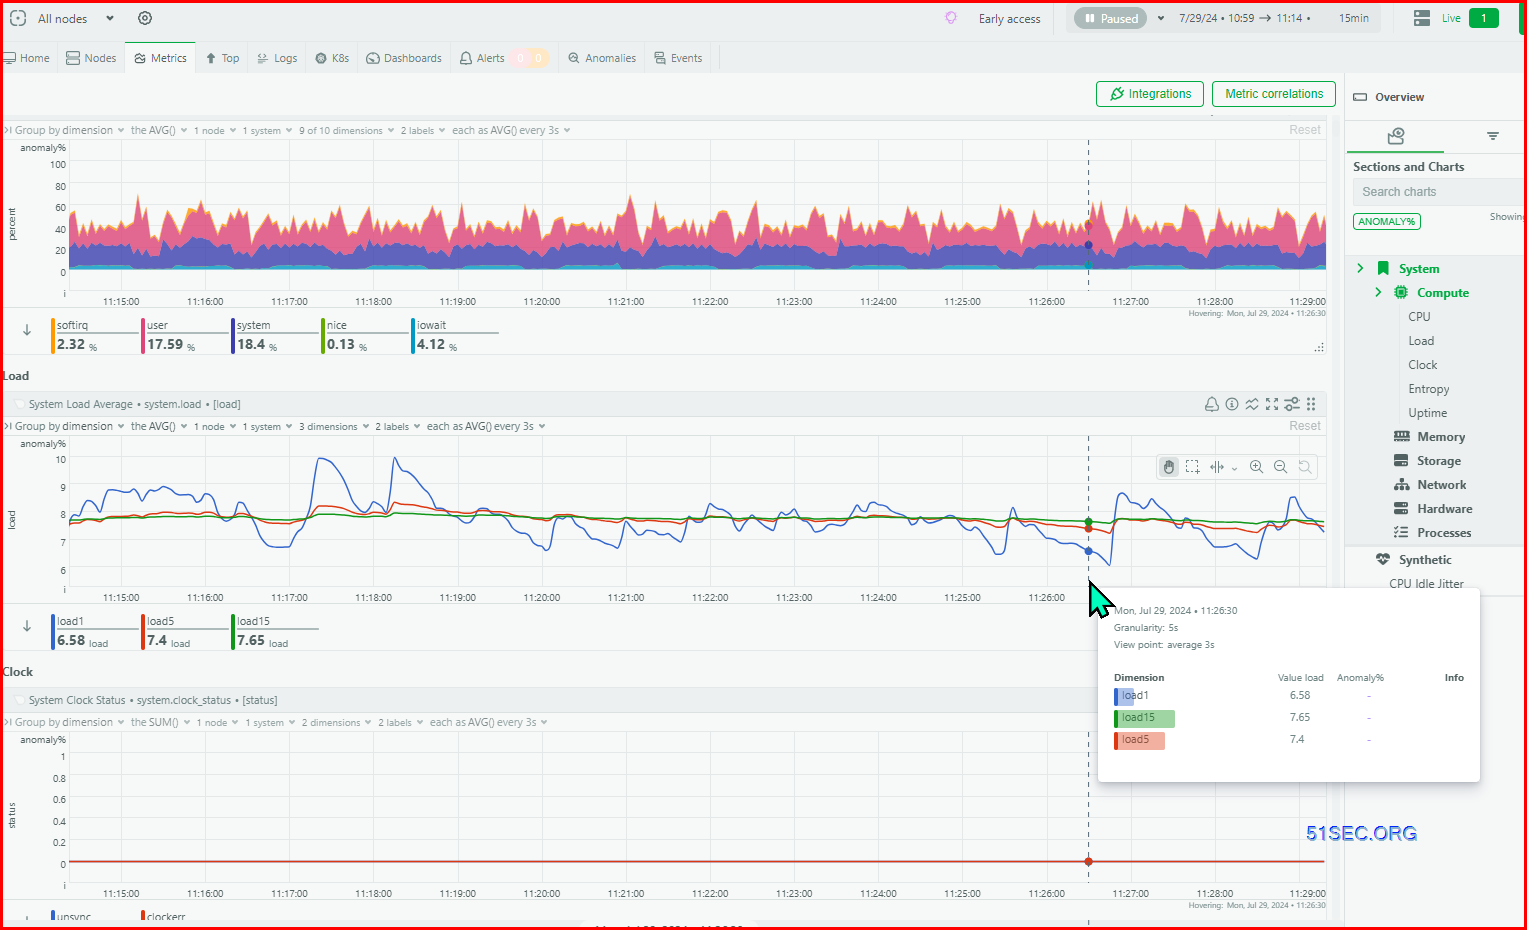
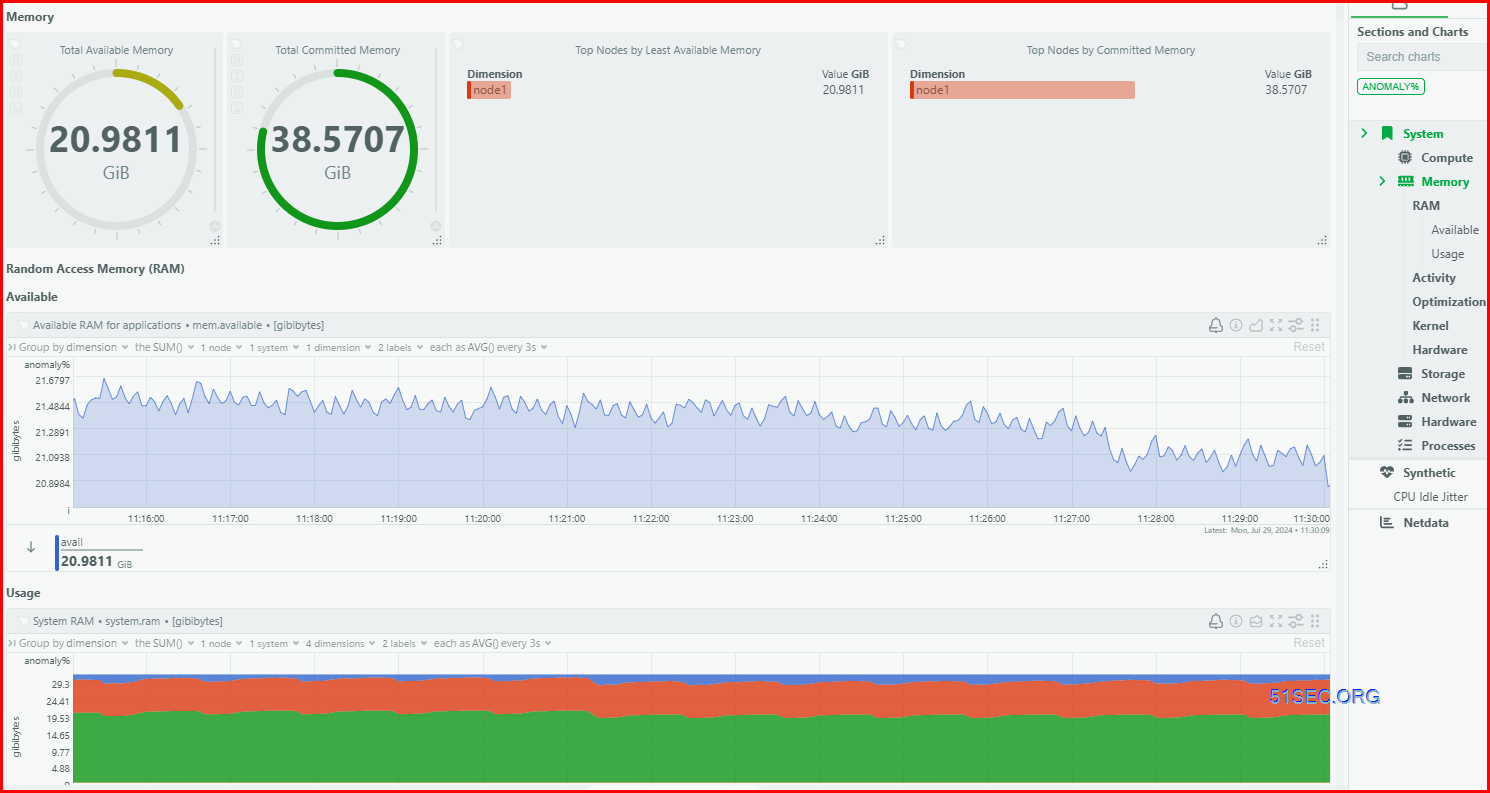
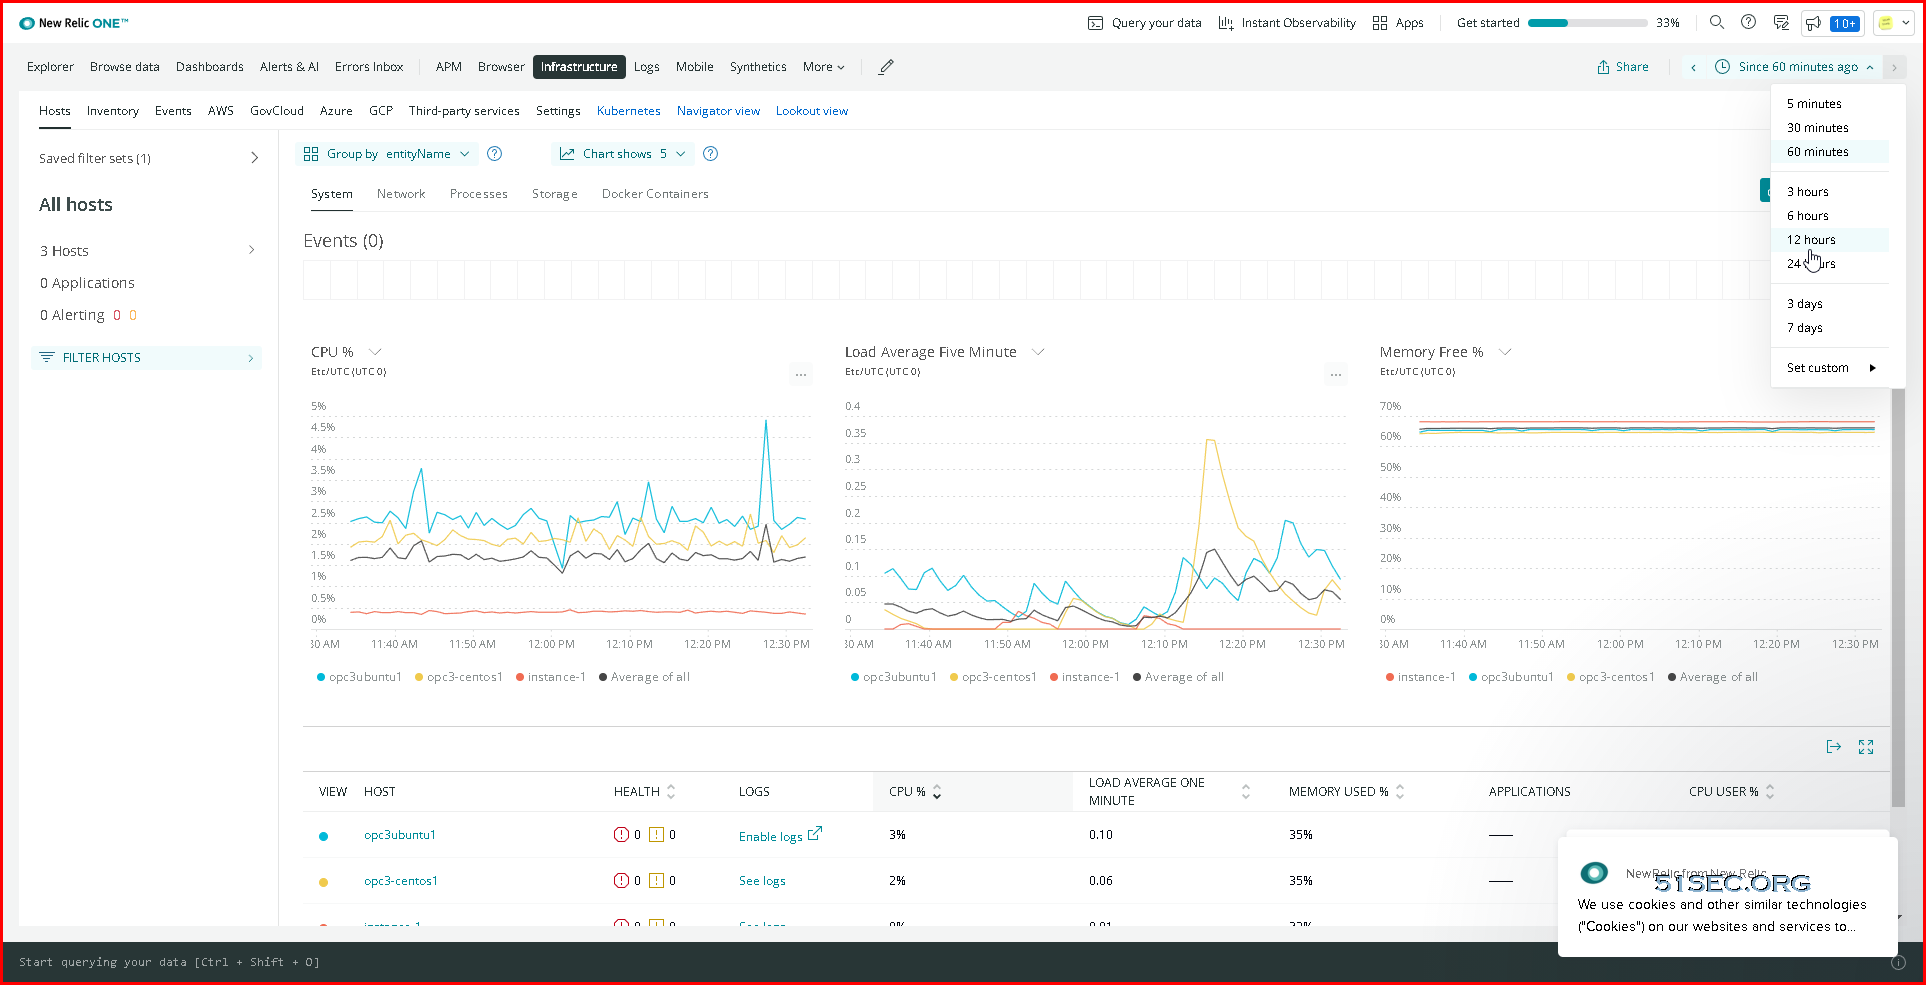
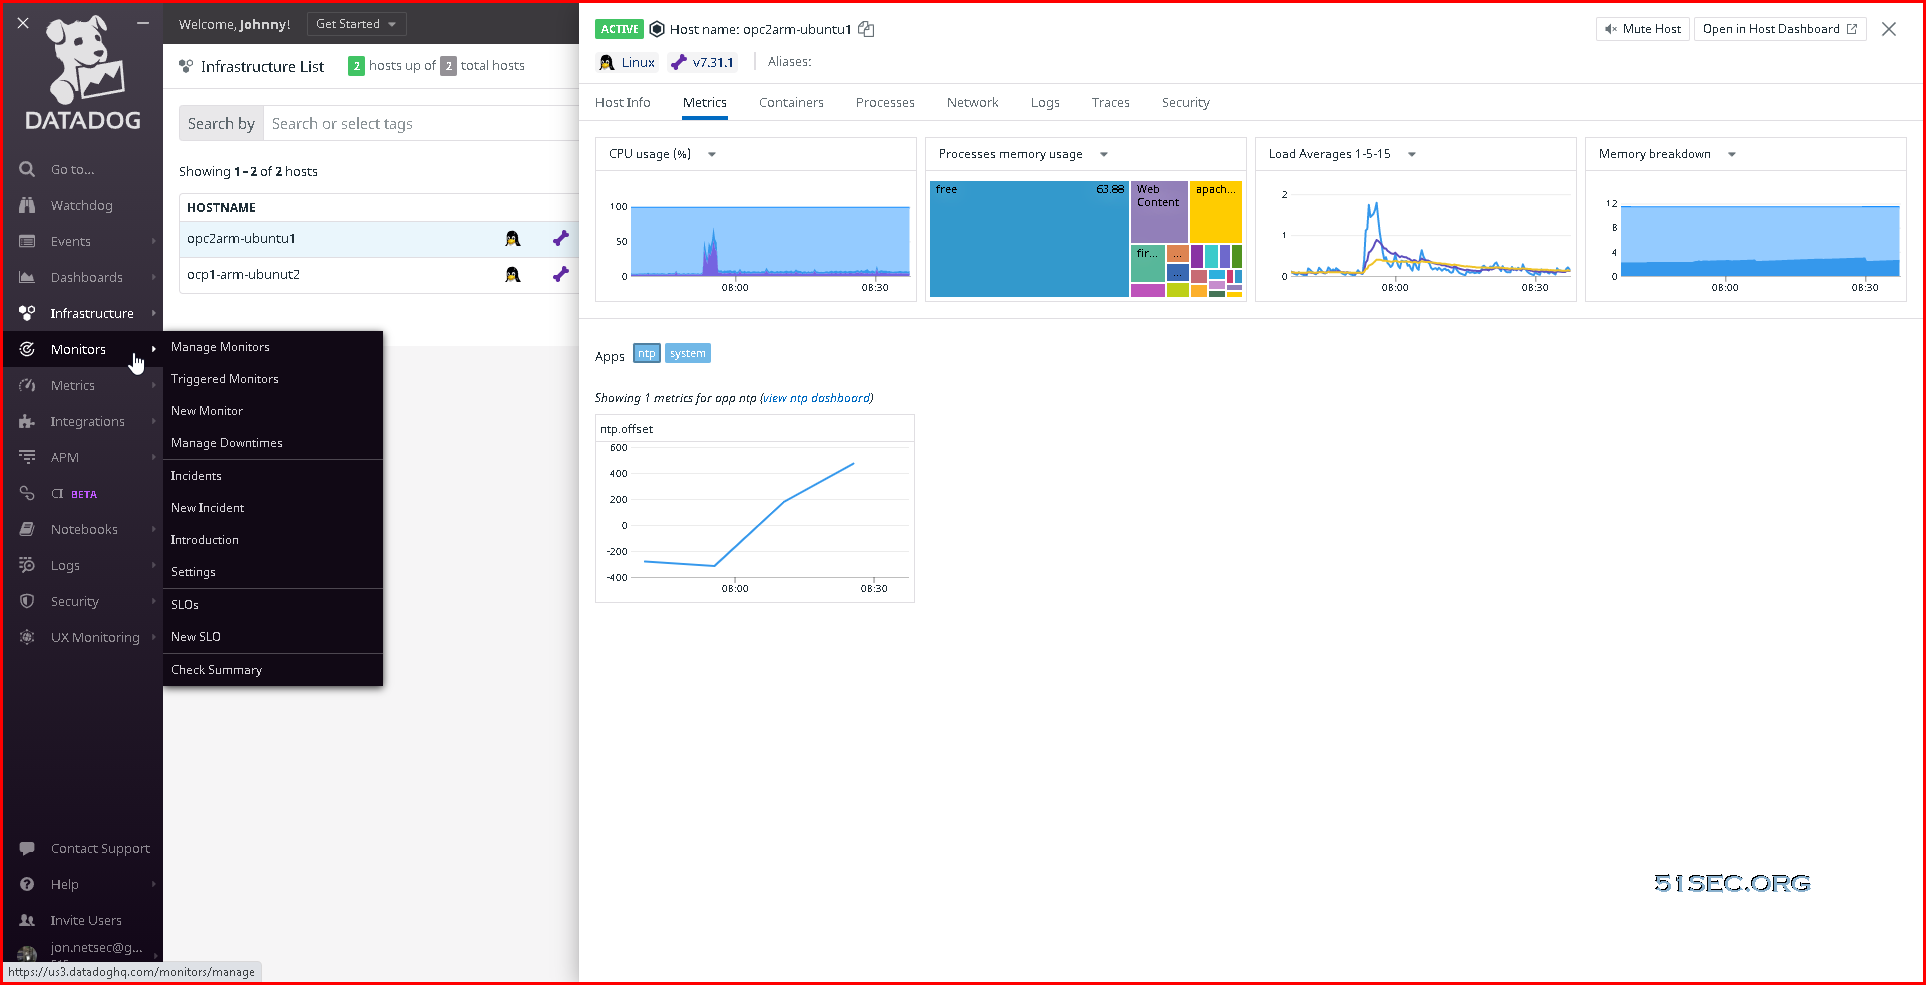
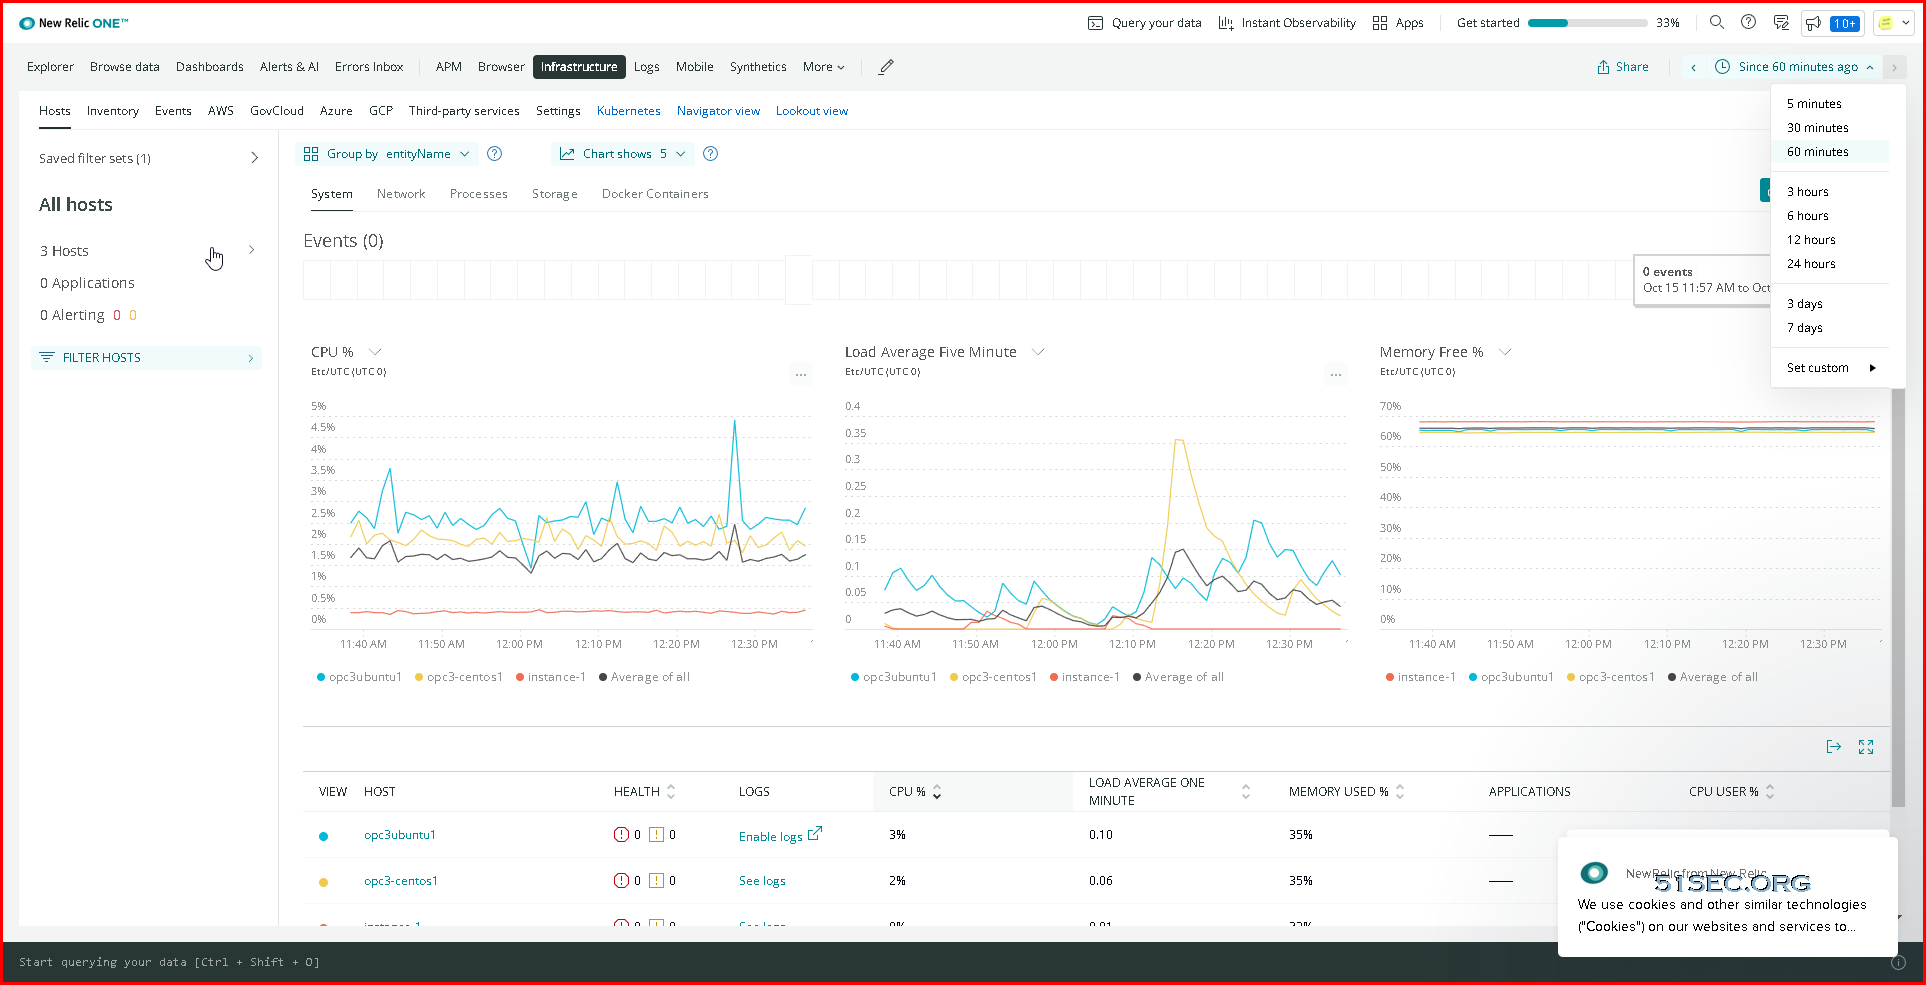
Dashboard Screenshots
Netdata
Per sec update for CPU:
New Relic:
Datadog
Instrumental
Netdata
Data stored on local
Netdata offers a granular approach to data retention, allowing you to manage storage based on both time and disk space. This provides greater control and helps you optimize storage usage for your specific needs.
Default Retention Limits:
| Tier | Resolution | Time Limit | Size Limit |
|---|---|---|---|
| 0 | high (per second) | 14 days | 1 GiB |
| 1 | middle (per minute) | 3 months | 1 GiB |
| 2 | low (per hour) | 2 years | 1 GiB |
With these defaults, Netdata requires approximately 4 GiB of storage space (including metadata).
From:
- https://learn.netdata.cloud/docs/netdata-agent/configuration/optimizing-metrics-database/change-how-long-netdata-stores-metrics#
Change the limit
The Netdata config directory: Some operating systems will use /opt/netdata/etc/netdata/ as the config directory. If you're not sure where yours is, navigate to http://NODE:19999/netdata.conf in your browser, replacing NODE with the IP address or hostname of your node, and find the # config directory = setting.
You can change these limits in netdata.conf:
[db]
    mode = dbengine
    storage tiers = 3

    # Tier 0, per second data. Set to 0 for no limit.
    dbengine tier 0 disk space MB = 1024
    dbengine tier 0 retention days = 14

    # Tier 1, per minute data. Set to 0 for no limit.
    dbengine tier 1 disk space MB = 1024
    dbengine tier 1 retention days = 90

    # Tier 2, per hour data. Set to 0 for no limit.
    dbengine tier 2 disk space MB = 1024
    dbengine tier 2 retention days = 730
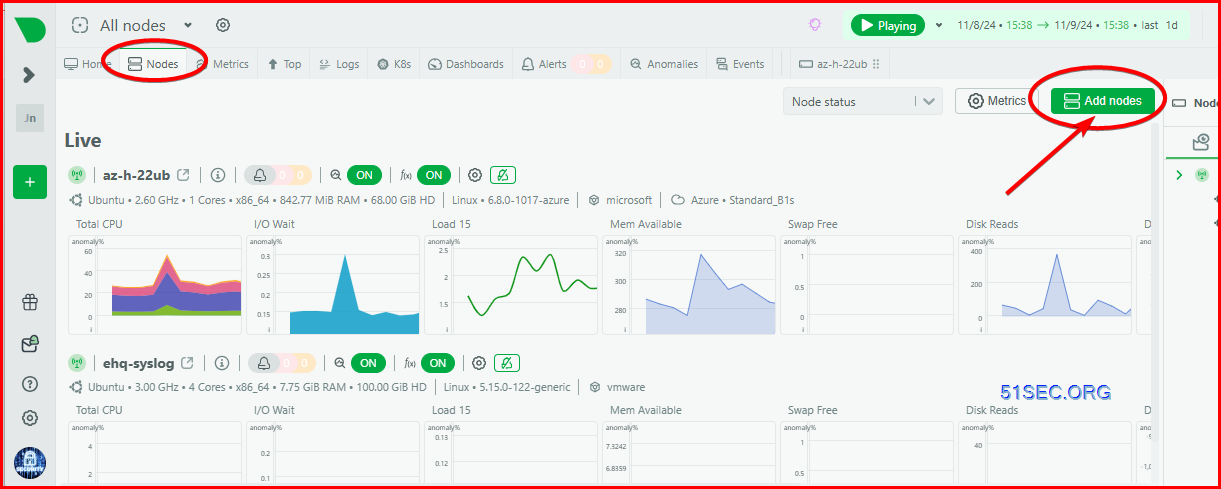
Add Node:
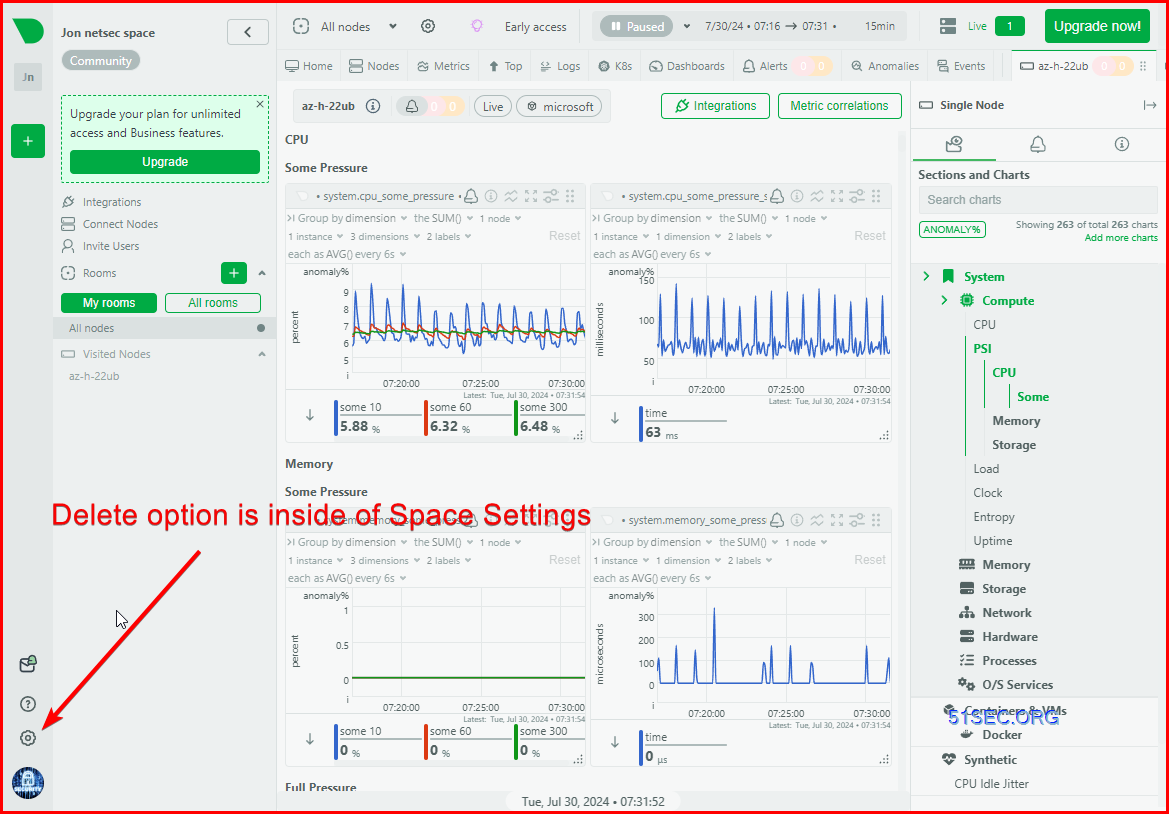
Delete Node:
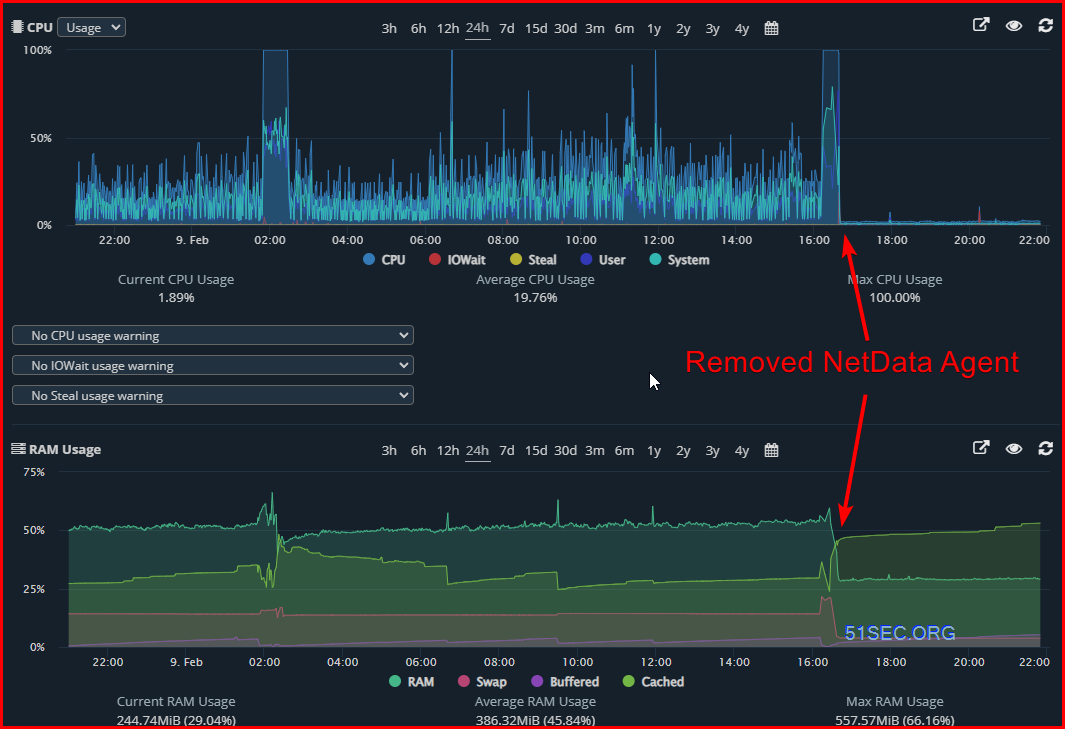
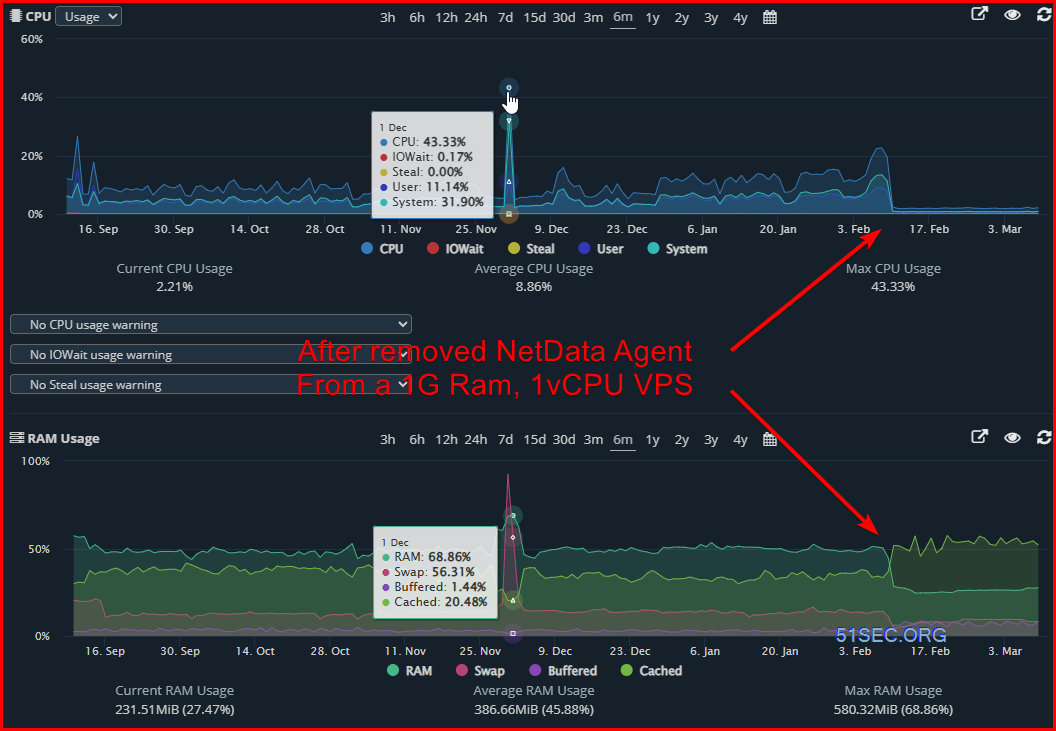
Remove Netdata agent script:
https://community.netdata.cloud/t/uninstalling-netdata-and-all-traces-ubuntu-server/3653
!#/bin/bash
# completely uninstall / purge and remove all configs for netdata
# Netdata installed through Kickstarter.sh has a different directory structure from apt-get install netdata.
# this file gets them both gone, as well as any cloud affililations
sudo killall netdata
sudo wget -O /tmp/netdata-kickstart.sh https://my-netdata.io/kickstart.sh && sh /tmp/netdata-kickstart.sh --uninstall --non-interactive
sudo systemctl stop netdata
sudo systemctl disable netdata
sudo systemctl unmask netdata
sudo rm -rf /lib/systemd/system/netdata.service
sudo rm -rf /lib/systemd/system/netdata-updater.service
sudo rm -rf /lib/systemd/system/netdata-updater.timer
sudo rm -rf /etc/logrotate.d/netdata
sudo /usr/libexec/netdata/netdata-uninstaller.sh --yes --env /etc/netdata/.environment
sudo apt-get --purge remove netdata -y
sudo rm /usr/lib/netdata* -R
sudo rm /var/lib/apt/lists/packagecloud.io_netdata_* -R
sudo rm /etc/init.d/netdata
sudo rm /etc/rc0.d/K01netdata
sudo rm /etc/rc1.d/K01netdata
sudo rm /etc/rc2.d/K01netdata
sudo rm /etc/rc3.d/K01netdata
sudo rm /etc/rc4.d/K01netdata
sudo rm /etc/rc5.d/K01netdata
sudo rm /etc/rc6.d/K01netdata
sudo rm /etc/rc0.d/S01netdata
sudo rm /etc/rc1.d/S01netdata
sudo rm /etc/rc2.d/S01netdata
sudo rm /etc/rc3.d/S01netdata
sudo rm /etc/rc4.d/S01netdata
sudo rm /etc/rc5.d/S01netdata
sudo rm /etc/rc6.d/S01netdata
sudo rm /usr/sbin/netdata
sudo rm -rf /var/lib/dpkg/info/netdata* -R
sudo rm -rf /var/lib/apt/lists/packagecloud.io_netdata* -R
sudo rm -rf /usr/share/netdata -R
sudo rm -rf /usr/share/doc/netdata* -R
sudo rm /usr/share/lintian/overrides/netdata*
sudo rm /usr/share/man/man1/netdata.1.gz
sudo rm /var/lib/systemd/deb-systemd-helper-enabled/netdata.service.dsh-also
sudo rm /var/lib/systemd/deb-systemd-helper-enabled/multi-user.target.wants/netdata.service
sudo rm /var/lib/systemd/deb-systemd-helper-masked/netdata.service
sudo rm -rf /usr/lib/netdata -R
sudo rm -rf /etc/rc2.d/S01netdata -R
sudo rm -rf /etc/rc3.d/S01netdata -R
sudo rm -rf /etc/rc4.d/S01netdata -R
sudo rm -rf /etc/rc5.d/S01netdata -R
sudo rm -rf /etc/default/netdata -R
sudo rm -rf /etc/apt/sources.list.d/netdata.list
sudo rm -rf /etc/apt/sources.list.d/netdata-edge.list
sudo rm -rf /etc/apt/trusted.gpg.d/netdata-archive-keyring.gpg
sudo rm -rf /etc/apt/trusted.gpg.d/netdata-edge-archive-keyring.gpg
sudo rm -rf /etc/apt/trusted.gpg.d/netdata-repoconfig-archive-keyring.gpg
sudo rm -rf /SM_DATA/sm_virt_machines/media/netdata-uninstaller.sh
sudo rm -rf /SM_DATA/sm_virt_machines/media/netdata*
sudo rm -rf /SM_DATA/working/netdata-kickstart*
sudo rm -rf /usr/share/lintian/overrides/netdata
sudo rm -rf /var/cache/apt/archives/netdata*
sudo rm -rf /opt/netdata*
sudo rm -rf /etc/cron.daily/netdata-updater
sudo rm -rf /usr/libexec/netdata -R
sudo rm -rf /var/log/netdata -R
sudo rm -rf /var/cache/netdata -R
sudo rm -rf /var/lib/netdata -R
sudo rm -rf /etc/netdata -R
sudo rm -rf /opt/netdata -R
systemctl daemon-reload
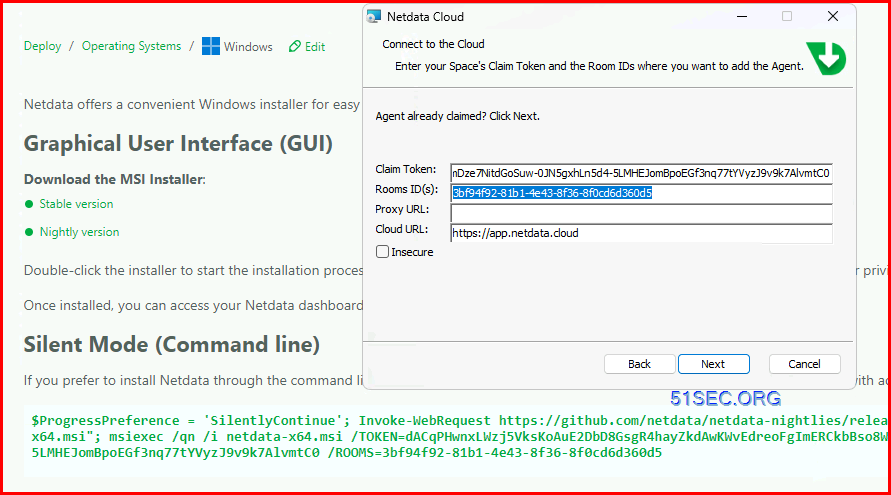
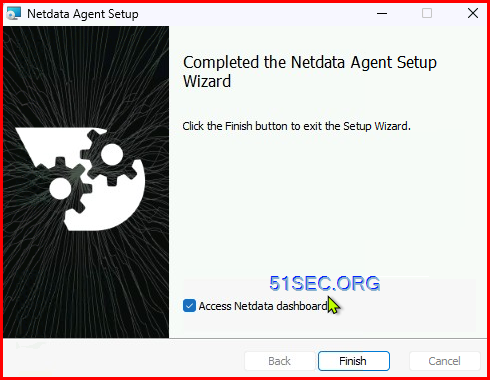
NetData Agent Installation
Windows:
Linux:
NetData Docker
docker run -d --name=netdata \
  -p 19999:19999 \
  -v /proc:/host/proc:ro \
  -v /sys:/host/sys:ro \
  -v /var/run/docker.sock:/var/run/docker.sock:ro \
  --cap-add SYS_PTRACE \
  --security-opt apparmor=unconfined \
netdata/netdataversion: '3'
services:
netdata:
image: netdata/netdata
hostname: example.com # set to fqdn of host
ports:
- 19999:19999
cap_add:
- SYS_PTRACE
security_opt:
- apparmor:unconfined
volumes:
- /proc:/host/proc:ro
- /sys:/host/sys:ro
- /var/run/docker.sock:/var/run/docker.sock:roLatest docker commands or docker-compse-yml file:
- https://learn.netdata.cloud/docs/netdata-agent/installation/docker
YouTube Videos
References
- https://www.netdata.cloud/








No comments:
Post a Comment